IMAGE

Fig 3

ID
ZDB-IMAGE-240807-56
Source
Figures for Kilinç et al., 2024
Image
Figure Caption

Fig 3

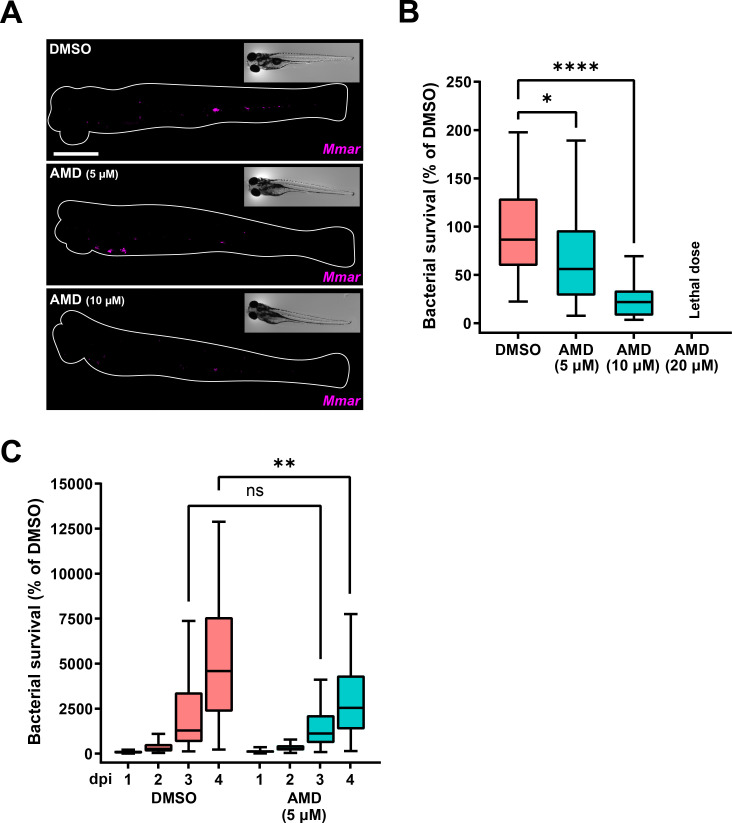
Amiodarone restricts Mmar infection in a host-directed manner. (A) Bacterial burden assay of mWasabi-expressing Mmar-infected zebrafish larvae treated with increasing doses of amiodarone (5, 10, and 20 µM) or vehicle control dimethyl sulfoxide (DMSO). Treatment was started at 1 hpi. and larvae were anesthetized at 4 dpi for imaging. Representative stereo fluorescent images of whole larvae infected with mWasabi-expressing Mmar. Magenta shows Mmar. Scale bar annotates 1 mm. (B) Quantification of bacterial burden shown in panel A. Bacterial burden was normalized to the mean of the control. Data from two independent experiments were combined (n = 39–42 per group). Boxplots with 95% confidence intervals are shown, and the black line in the boxplots indicates the group median. Statistical significance was tested using a Kruskal-Wallis with Dunn’s multiple comparisons test. (C) Bacterial burden assay of mWasabi-expressing Mmar-infected zebrafish larvae treated with 5 µM of amiodarone or vehicle control DMSO. Treatment was started at 1 hpi, and larvae were anesthetized at 1, 2, 3, and 4 dpi for imaging. Bacterial burden was normalized to the control (DMSO at 1 dpi), and data from two experimental repeats were combined (n = 65–70 per group). Boxplots with 95% confidence intervals are shown, and the black line in the boxplots indicates the group median. Statistical significance was tested using a Kruskal-Wallis with Dunn’s multiple comparisons test. ns, non-significant; *P < 0.05; **P < 0.01; and ****P < 0.0001.

Acknowledgments
This image is the copyrighted work of the attributed author or publisher, and ZFIN has permission only to display this image to its users. Additional permissions should be obtained from the applicable author or publisher of the image. Full text @ Microbiol Spectr