
|
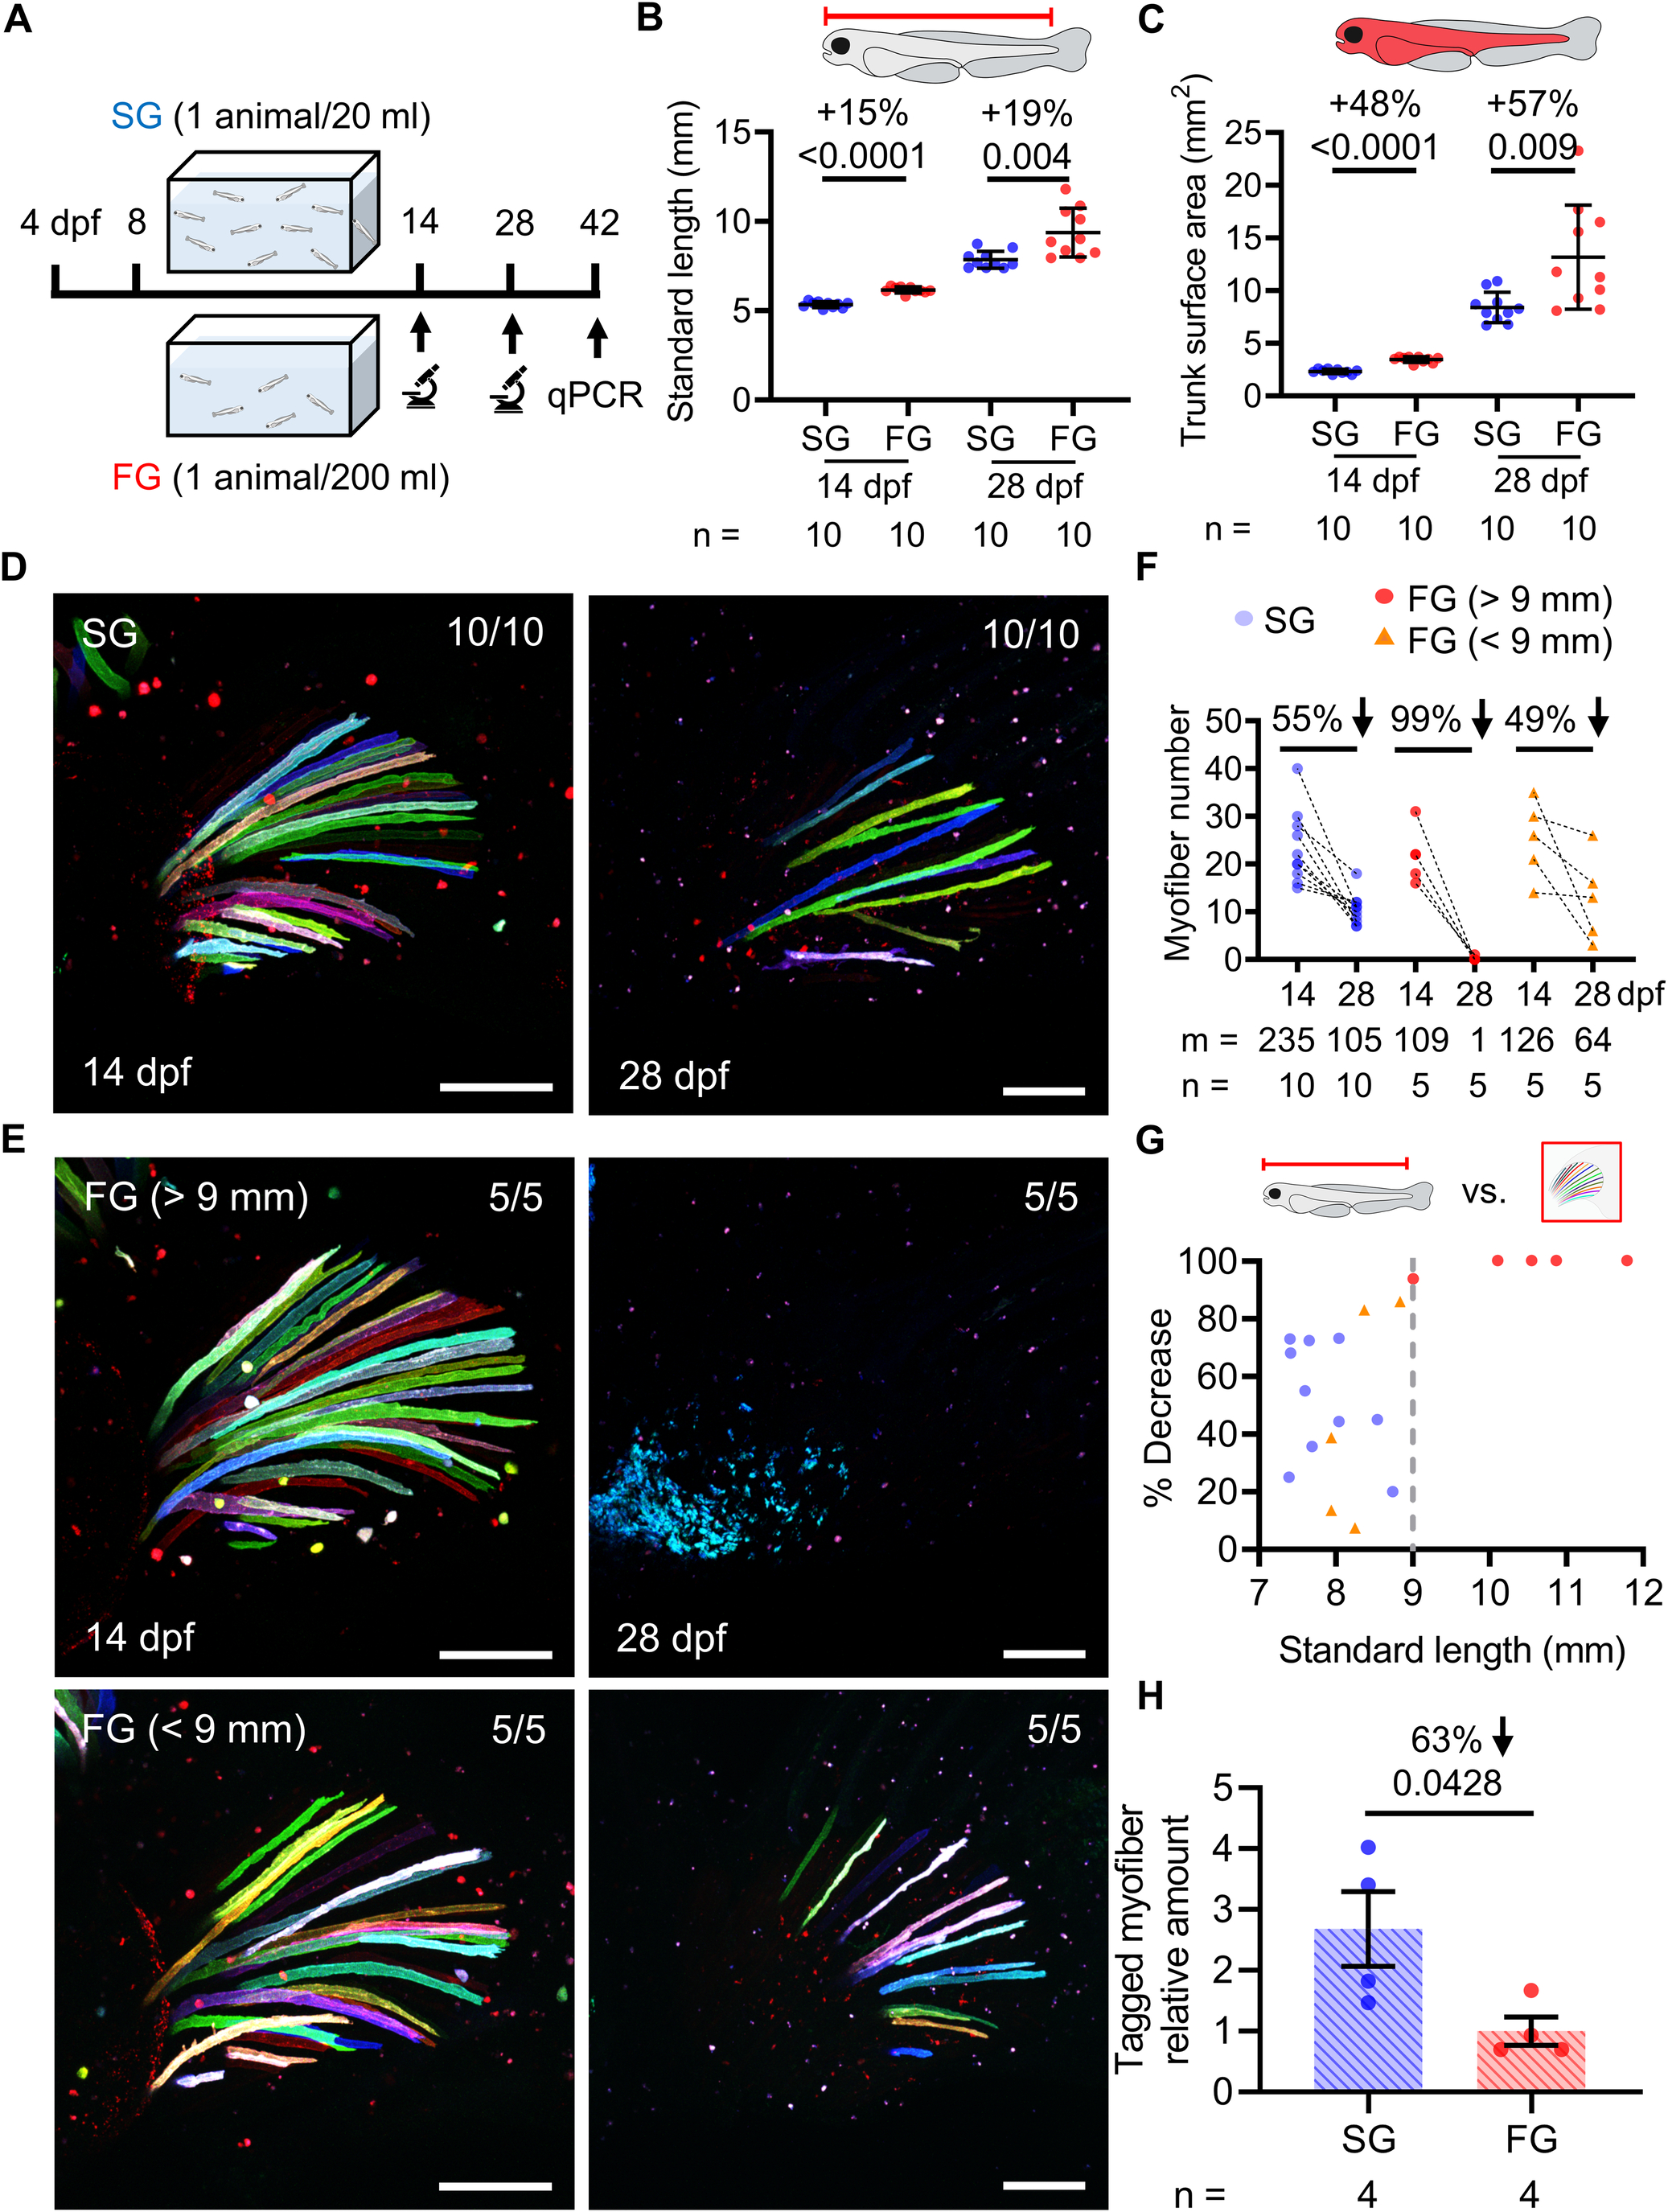
Fig. EV4 Rapid growth condition promotes myofiber elimination. (A) Timeline of larval growth manipulation and tracking scheme. SG, slow growth. FG, fast growth. (B, C) Larval growth under the SG and FG conditions as determined by standard length (B), and trunk surface area (C). (D, E) Long-term tracking of the Tg(palmuscle-Multi; myofiber:iCre#2) double transgenic line under SG (D) and FG (E) conditions. (F, G) Quantification of tagged myofiber numbers (F) and decreases in percentage (G). Gray dashed line highlights the standard length of 9 mm. (H) RT-qPCR analysis of whole-animal myofiber loss at 42 dpf under either SG or FG conditions. Data from biological replicates are shown as mean ± standard deviation (B, C) and mean ± standard error (H). Significance was examined by two-tailed Student’s t-test. Percent differences and P values are shown above the horizontal lines for intergroup comparisons. n = number of animals (B–F) or biological replicates (H). m = number of myofibers (F). Scale bar, 100 µm (D, E). dpf, days post-fertilization.