
Fig. 1
- ID
- ZDB-IMAGE-240802-1
- Publication
- Tanaka et al., 2024 - Latrophilin-2 mediates fluid shear stress mechanotransduction at endothelial junctions
- All Figures
- Figures for Tanaka et al., 2024
|
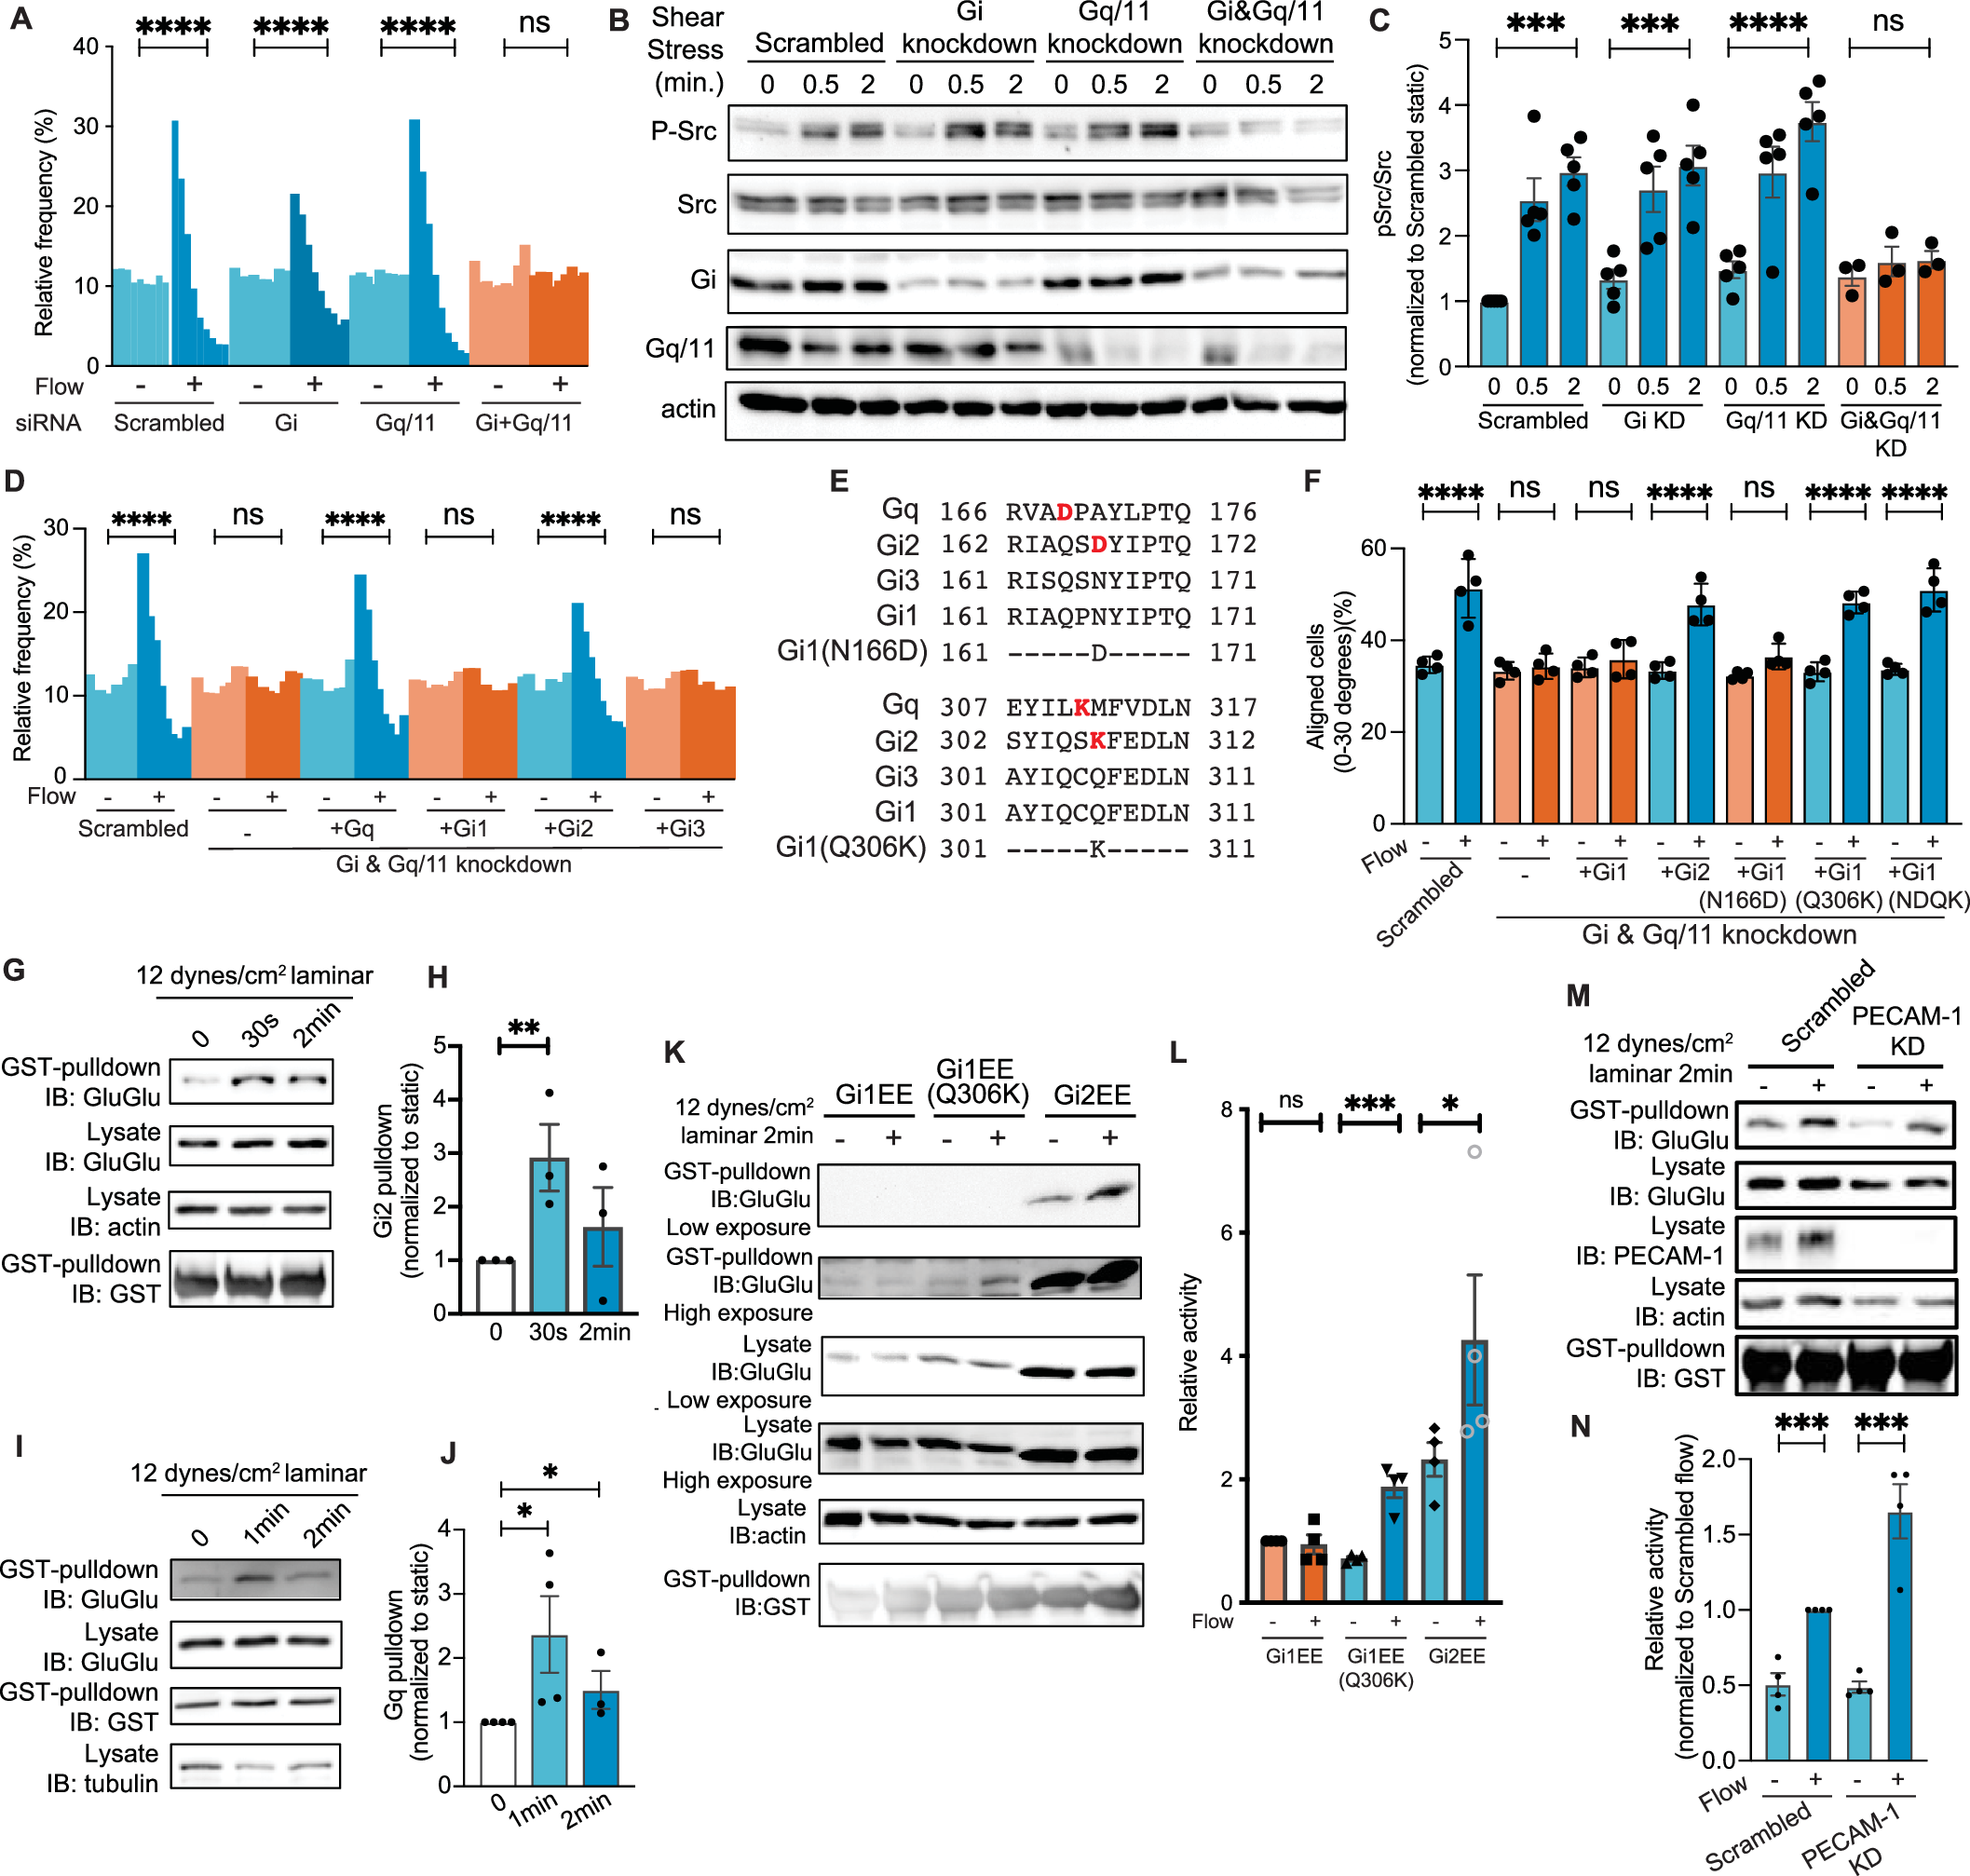
Fig. 1 Gα proteins specific for endothelial flow responses. (A) Flow-induced endothelial alignment after Gα knockdown. HUVECs were subjected to fluid shear stress (FSS) at a rate of 12 dynes/cm2 for 16 h, and nuclear orientation quantified as histograms showing the percentage of cells within each 10° of the flow directions from 0° to 90° (see “Methods”) ****P < 0.0001; one-way ANOVA with Tukey’s multiple comparisons test. (B) Src family kinase activation, quantified in (C). n = 5 for control, Gi knockdown, Gq11 knockdown and n = 3 for simultaneous knockdown of Gi and Gq11. Values are means ± SEM. ****P < 0.0001, ***P < 0.001; one-way ANOVA with Tukey multiple comparison test. (D) Rescue of Gq/11 and Gi knockdown by re-expression of siRNA-resistant versions of the indicated proteins. ****P < 0.0001; one-way ANOVA with Tukey’s multiple comparison test. (E) Amino acid sequences of Gαi1, Gαi2, and Gαi3 at the mutation sites of Gαi1 gain-of-function mutant. (F) Rescue of Gq/11 and Gi knockdown with indicated Gα proteins. Each point corresponds to one measurement averaged from >500 cells. N = 4. ****P < 0.0001; one-way ANOVA with Tukey’s multiple comparisons test. (G) GINIP pulldown assay for activation of Gαi2 by FSS. N = 3. Results quantified in (H). **P = 0.0185, Student’s t test. (I) GRK2N pulldown assay for activation of Gq. N = 4, quantified in (J). *P < 0.05, Student’s t test. (K) GINIP pulldown assay for FSS-induced activation of wild-type and Q306K Gαi1. N = 4, quantified in (L). *P = 0.0304, ***P = 0.0017; Student’s t test. (M) Gi2 activation after PECAM-1 knockdown. HUVECs expressing GluGlu-tagged Gi2 were transfected with scrambled siRNA or PECAM-1 siRNA, exposed to FSS, and Gi2 activation assayed as described above, quantified in (N). Values are means ± SEM, normalized to input Gα protein levels. ***P < 0.001; Student’s t test, N = 4.