
Fig. 2
- ID
- ZDB-IMAGE-240731-2
- Publication
- Xie et al., 2024 - Zebrafish myo7aa affects congenital hearing by regulating Rho-GTPase signaling
- All Figures
- Figures for Xie et al., 2024
|
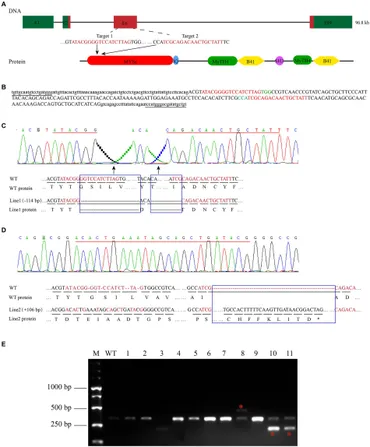
Fig. 2 Zebrafish myo7aa gene knockout. (A) Schematic representation of the CRISPR/Cas9 target region in myo7aa gene. Green box represents the 3′UTR and 5′UTR, while the red box indicates exons. (B) Sequence of the CRSIPR/Cas9 target region in the myo7aa gene. Underlined: detection primers; red font: target site sequence; green font: PAM sequence; capital letters: exon sequence; lowercase letters: intron sequences. (C,D) Sequencing peak map, genomic DNA sequence, and amino acid sequence between two independent mutant alleles. Compared with the wild type, the myo7aa line1 mutation had a 114 bp deletion and the line2 mutation had a 106 bp insertion. The sequence of the target site is shown in red. Rectangular boxes indicate deletion or insertion sites in the mutant. *Indicates termination of protein translation. (E) The screening results of the F1 generation adult fish showed the presence of DNA marker, wild type fish, and mutant fish.