
Fig. 6
- ID
- ZDB-IMAGE-240730-6
- Publication
- Roychaudhury et al., 2024 - SRPK3 Is Essential for Cognitive and Ocular Development in Humans and Zebrafish, Explaining X-Linked Intellectual Disability
- All Figures
- Figures for Roychaudhury et al., 2024
|
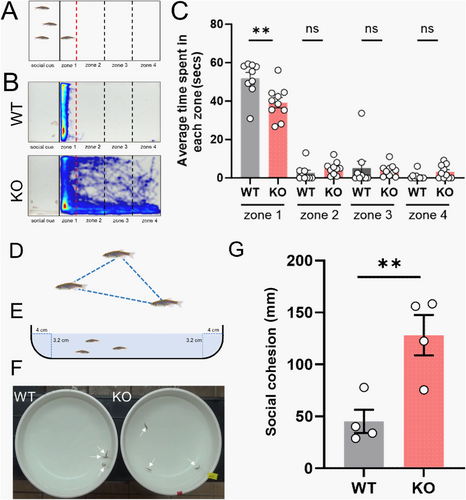
Fig. 6 srpk3 knockout (KO) adult zebrafish show impairment in social interaction. (A) Representative image of the experimental setup of social interaction assay in adult zebrafish. (B) Heat map analysis of social interaction assay in adult zebrafish. Three wild-type (WT) fish were used as social cue and 1 as an experimental fish. Black bold line indicates the position of the transparent separator in the water tank. Red and black dashed lines show relative positions of 4 different zones. Video tracking was analyzed at 2 different time bins; early stage (2–7 min) and late stage (10–15 min), respectively. (C) Mean time spent by the experimental fish in each zone at late stage of social interaction assay. (D) Representative image of 3 shoaling fish. (E) Representative image of the parameters of bowl used for shoaling bowl assay. (F) Experimental set up for shoaling bowl assay. Individual adult fish were pointed by arrows. (G) Quantified data for the average of the inter-fish distance of the shoaling assay. The test was performed in triplicates. For each trial, 3 fish of each genotype were used. Number of experimental fish used; n = 10 for WT and n = 10 for KO. All data are represented as mean ± SEM. **p<0.01 by t test.