
Image
|
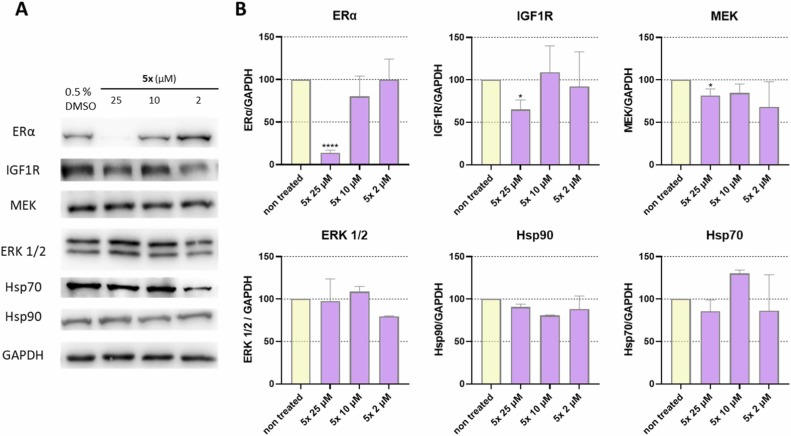
Figure Caption
Fig. 8 Western blot analysis of effects of compound 5x in MCF-7 cell line on Hsp90 client protein levels (ERα, IGF1R, MEK, ERK 1/2) and representative heat shock proteins (Hsp70, Hsp90) after 24 hours of treatment. A) Representative Western blot images; B) Quantification results normalised on GAPDH levels. The bars represent mean values with SD and Welch’s t-test was used to evaluate statistical significancy (*p<0.05, **p<0.01, ***p<0.001, ****p<0.0001). Full images used for quantification are shown in Supplementary information Figures 11S-14S .
Acknowledgments
This image is the copyrighted work of the attributed author or publisher, and
ZFIN has permission only to display this image to its users.
Additional permissions should be obtained from the applicable author or publisher of the image.
Full text @ Biomed. Pharmacother.