
|
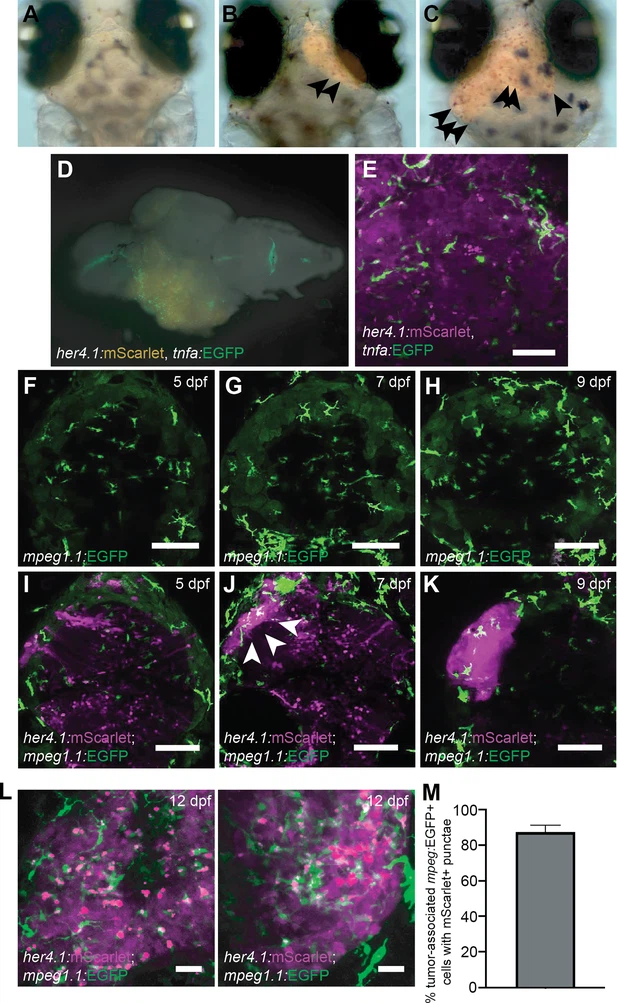
Fig. 3 p53EPS recruits activated microglia/macrophages at early stages of tumor initiation. (A–C) Neutral red staining of p53EPS mScarlet tumor-negative (A) and mScarlet tumor-positive brains (B, C) at 10 days post fertilization (dpf). Neutral red foci in early-stage lesions are highlighted with arrows and are indicative of phagocytic cells. (D) Whole brain with p53EPS-induced tumor in a transgenic Tg(tnfa:EGFP) zebrafish at 20 dpf. (E) Z-stack projection of live confocal imaging of p53EPS tumor in transgenic Tg(tnfa:EGFP) background. (F–K) Z-stack projections of control uninjected (F–H) and p53EPS brains (I–K) at 5 dpf (F ,I), 7 dpf (G, J), and 9 dpf (H, K) in transgenic Tg(mpeg1.1:EGFP) background. White arrows highlight an early-stage p53EPS lesion and associated mpeg:EGFP+ cells. (L) Z-stack projections of two independent p53EPS brains at 12 dpf in transgenic Tg(mpeg1.1:EGFP) background. (M) Quantification of tumor-associated mpeg1.1:EGFP+ cells with overlapping and/or internalized her4.1:mScarlet+ punctae (n=3 independent tumors).