
|
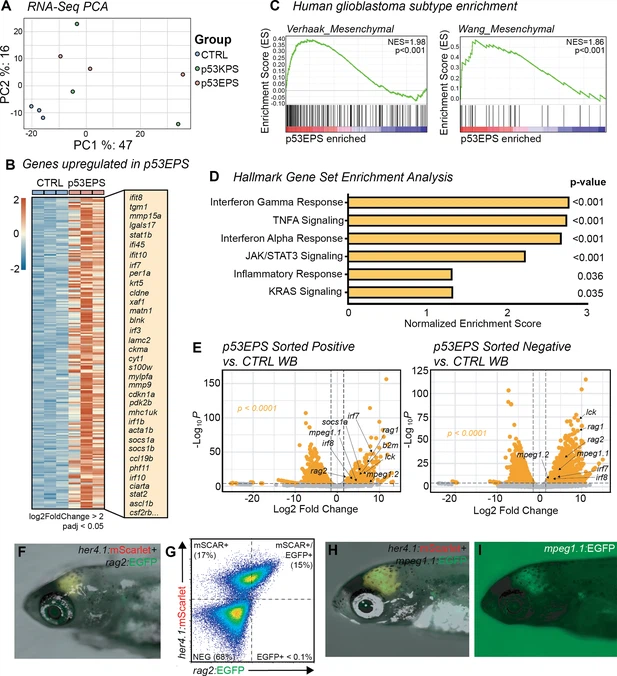
Fig. 2 RNA expression analysis establishes enrichment of mesenchymal glioblastoma and inflammation signatures in p53EPS model. (A) Principal component analysis (PCA) of mRNA sequencing from whole control-injected brains (CTRL), p53EPS, and p53KPS tumor-burdened brains. (B) Heatmap of normalized counts for genes upregulated in p53EPS tumor-burdened brains (log2foldChange>2, padj<0.05), compared to whole control-injected brains (CTRL). A selected list of upregulated transcripts is indicated. (C) Gene set enrichment analysis (GSEA) plots of published gene signatures for mesenchymal subtype glioblastoma for genes differentially regulated in p53EPS compared to control-injected brains (McLendon et al., 2008; Wang et al., 2017). Normalized enrichment scores (NES) and nominal p-values are indicated. (D) Bar plot of NES from GSEA of Hallmark gene sets (Villanueva et al., 2011). (E) Volcano plots of differentially expressed genes between sorted mScarlet+ p53EPS tumor cells and control-injected whole brain tissue (CTRL WB), as well as between sorted mScarlet-negative cells from p53EPS tumor-burdened brains and control-injected whole brains (CTRL WB). (F) her4.1:mScarlet and rag2:EGFP expression in live zebrafish with a p53EPS tumor at 30 days post fertilization (dpf). (G) Fluorescence-activated cell sorting (FACS) plot of p53EPS brain with rag2:EGFP co-expression from (F). (H, I) her4.1:mScarlet and mpeg1.1:EGFP expression in live zebrafish with a p53EPS tumor at 30 dpf.