
Image
|
Figure Caption
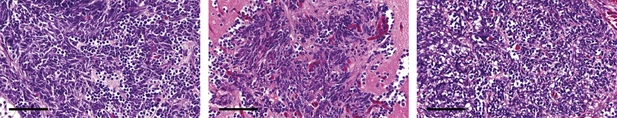
Fig. 1 Supplemental 2 Hematoxylin and eosin (H&E) staining of three independent p53EPS tumors. Scale bars represent 50 μm.
Acknowledgments
This image is the copyrighted work of the attributed author or publisher, and
ZFIN has permission only to display this image to its users.
Additional permissions should be obtained from the applicable author or publisher of the image.
Full text @ Elife