
IMAGE
Fig. 4
- ID
- ZDB-IMAGE-240725-12
- Publication
- Yu et al., 2024 - Loss of function of Vasoactive-intestinal peptide alters sex ratio and reduces male reproductive fitness in zebrafish
- All Figures
- Figures for Yu et al., 2024
Image
|
Figure Caption
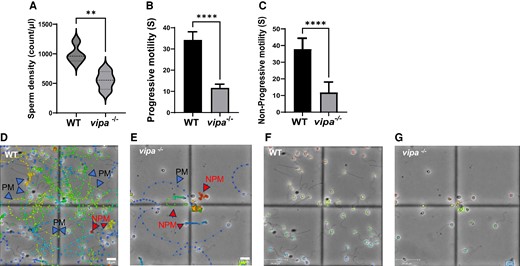
Fig. 4 Vipa−/− males display reduced sperm quality (A) average sperm density of WT and vipa−/− (n = 4). (B) Average sperm motility (n = 8), and (C) average progressive motility (n = 8). (D, E) sperm motility tracking of WT and vipa−/− males. Arrows point to either progressive (PM) or nonprogressive (NPM) motility paths. (F, G) Tracking video for vipa−/− and WT male sperm. Statistical analysis performed Welch 2-sample t-test. P (sperm density) = .0062, P (PM) < .0001, and P (NPM) < .0001. ****P < .0001, **P < .01.
Figure Data
Acknowledgments
This image is the copyrighted work of the attributed author or publisher, and
ZFIN has permission only to display this image to its users.
Additional permissions should be obtained from the applicable author or publisher of the image.
Full text @ Endocrinology