
Fig. 2
- ID
- ZDB-IMAGE-240725-10
- Publication
- Yu et al., 2024 - Loss of function of Vasoactive-intestinal peptide alters sex ratio and reduces male reproductive fitness in zebrafish
- All Figures
- Figures for Yu et al., 2024
|
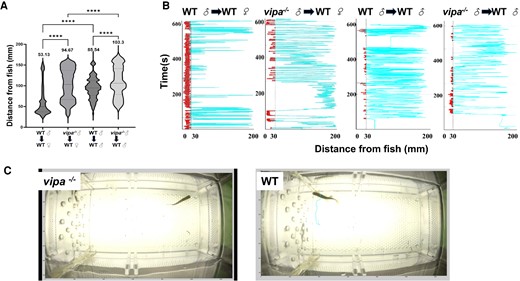
Fig. 2 vipa−/− males display reduced attraction to female. vipa−/− and WT males’ distance from WT female and male zebrafish and the time spent near confined females or males. (A) Time spent within 30 mm of female/male chambers by vipa−/− and WT males (n = 5 males of each type, respectively). (B) Tracking distribution map of a representative male of each type (WT and vipa−/−) using idTracker software to assess images taken at 30 frames/second intervals. (C) Thirty-second representative tracking videos of a vipa−/− (left) and WT male (right) with the same confined WT female (circled). Statistical analysis for (A) was performed on mean values using 1-way ANOVA, followed by Tukey's multiple comparisons test, ****P < .0001.