
Image
|
Figure Caption
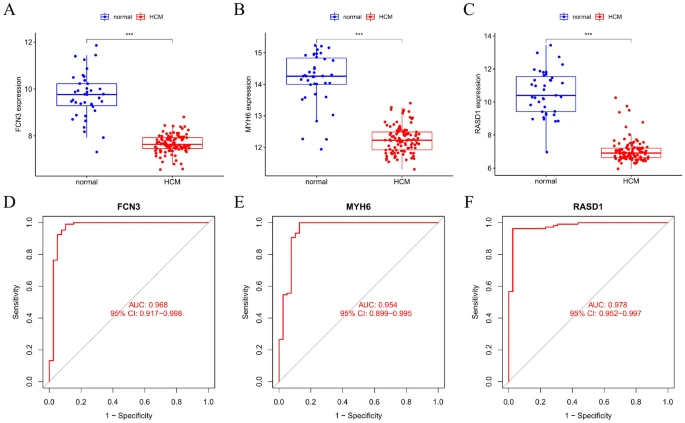
Fig. 6 Based on the GSE36961 dataset to validate the expression and diagnostic value of the 3 key signatures. (A,B) Differential expression analysis of FCN3 (A), MYH6 (B), and RASD1 (C) in normal control and HCM groups. (D,E) ROC curves to validate the diagnostic value of FCN3 (D), MYH6 (E), and RASD1 (F) in patients with HCM.
Acknowledgments
This image is the copyrighted work of the attributed author or publisher, and
ZFIN has permission only to display this image to its users.
Additional permissions should be obtained from the applicable author or publisher of the image.
Full text @ Sci. Rep.