
Image
|
Figure Caption
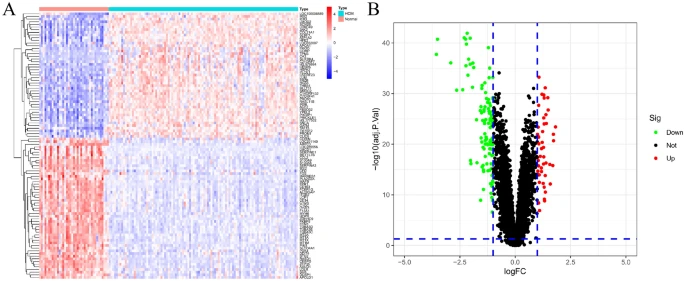
Fig. 1 Based on the GSE36961 dataset to screen for differentially expressed genes (DEGs) in HCM and normal controls. Heat maps (A) and volcano maps (B) showing DEGs, respectively.
Acknowledgments
This image is the copyrighted work of the attributed author or publisher, and
ZFIN has permission only to display this image to its users.
Additional permissions should be obtained from the applicable author or publisher of the image.
Full text @ Sci. Rep.