
Fig. 6
- ID
- ZDB-IMAGE-240716-18
- Publication
- Lu et al., 2024 - Localisation and function of key axonemal microtubule inner proteins and dynein docking complex members reveal extensive diversity among vertebrate motile cilia
- All Figures
- Figures for Lu et al., 2024
|
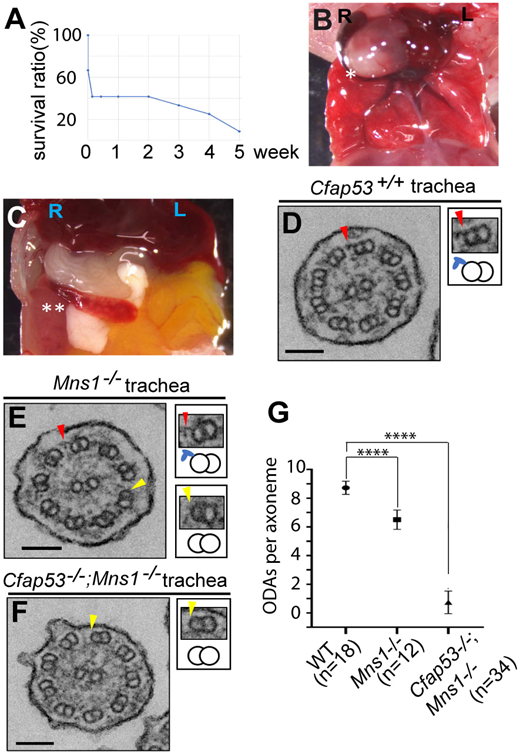
Fig. 6 ODA loss from Cfap53; Mns1 double mutant mouse (9+2) tracheal cilia. (A) Survival curve of Cfap53−/−; Mns1−/− double mutants. Mice analysed were 0-5 weeks of age, without sex bias. (B,C) Laterality defects of Cfap53−/−; Mns1−/− mice: heart apex (asterisk) in reversed (dextral) position (B), and spleen (double asterisk) in reversed (dextral) position (C). (D-F) Tracheal cilia TEM analysis from Cfap53+/+ (D), Mns1–/– (E) and Cfap53–/–; Mns1−/− mice (F). Insets show higher-magnification views of PMDs (arrowheads), together with their schematics including the ODAs (blue protrusions). Scale bars: 100 nm. (G) ODA number per tracheal cilium from wild-type control, Mns1−/− and Cfap53−/−; Mns1−/− mice. Data are presented as mean±s.d. ****P≤0.0001 (two-tailed Student's t-test).