
Fig. 4
- ID
- ZDB-IMAGE-240716-16
- Publication
- Lu et al., 2024 - Localisation and function of key axonemal microtubule inner proteins and dynein docking complex members reveal extensive diversity among vertebrate motile cilia
- All Figures
- Figures for Lu et al., 2024
|
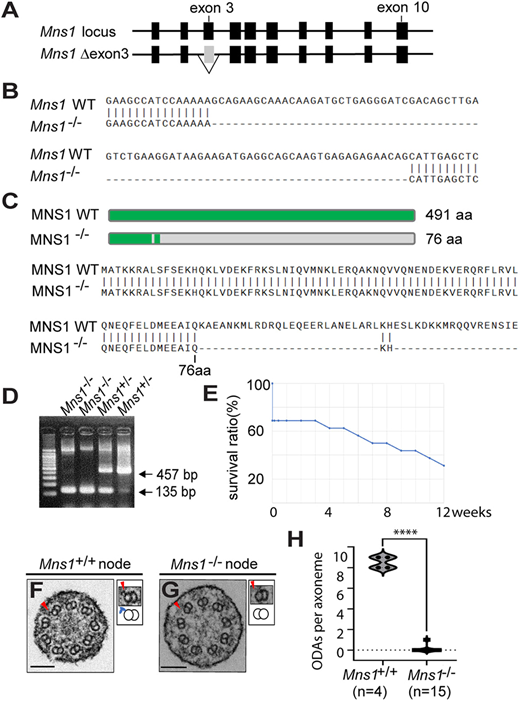
Fig. 4 ODA loss from Mns1 mutant mouse (9+0) nodal cilia. (A) Genetic structure of the wild-type Mns1 locus and generation of the knockout allele lacking exon 3. (B) Nucleotide sequence of the Mns1 mutant allele compared with wild type. (C) Schematic and amino acid sequence of the predicted MNS1 mutant protein compared with wild type. (D) PCR-based genotyping of Mns1−/− mice. (E) Survival curve of Mns1−/− mice. Mice analysed were 0-12 weeks of age, without sex bias. (F,G) TEM analysis of wild-type and Mns1–/– node cilia. Higher-magnification views of corresponding doublet microtubules (arrowheads), together with schematic diagrams of PMDs and ODAs (blue protrusions) are shown. Scale bars: 100 nm. (H) ODA number per node cilium from wild-type and Mns1−/− embryos. Data are presented as a violin plot. ****P≤0.0001 (two-tailed Student's t-test).