
|
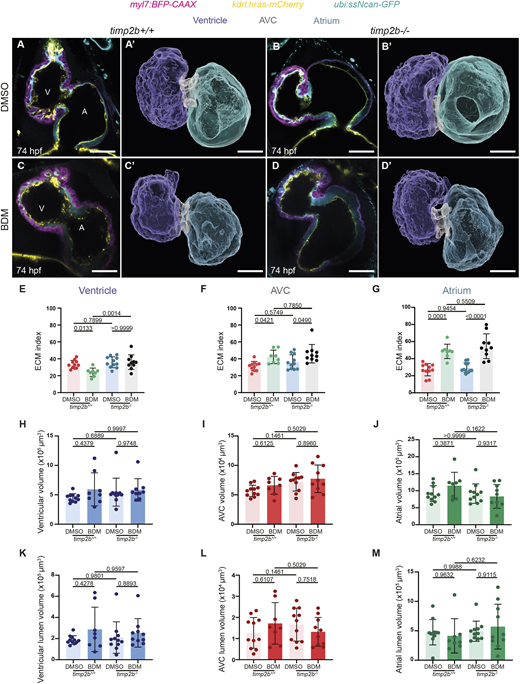
Fig. 5 Mechanical forces regulate cECM organization at least in part through timp2b. (A-D′) 74 hpf timp2b+/+ and timp2b−/− sibling hearts following treatment with DMSO and BDM starting at 50 hpf. Single-plane images and 3D surface renderings of 74 hpf timp2b+/+ (A,A′,C,C′) and timp2b−/− (B,B′,D,D′) sibling hearts following treatment with DMSO (A-B′) or BDM (C-D′) starting at 50 hpf. (E-G) Quantification of ventricular (E), AVC (F) and atrial (G) ECM indices of 74 hpf timp2b+/+ and timp2b−/− sibling hearts following treatment with BDM compared with DMSO controls starting at 50 hpf. BDM-induced reduction of the cECM index in timp2b+/+ ventricles is not apparent in timp2b−/− ventricles (E), indicating that timp2b expression is needed for the mechanical force-induced loss of the ventricular cECM index. cECM index in the AVC (F) and atrium (G) is still significantly higher when BDM treatment was used instead of DMSO treatment on timp2b+/+ and timp2b−/− siblings. (H-J) Quantification of the ventricular (H), AVC (I) and atrial (J) volumes. (K-M) Quantification of the ventricular (K), AVC (L) and atrial (M) lumen volumes. n=11 for DMSO, timp2b+/+; 8 for BDM, timp2b+/+; 11 for DMSO, timp2b−/−; and 10 for BDM, timp2b−/−. Plot values represent mean±s.d.; P-values determined by one-way ANOVA followed by multiple comparisons with Dunn test. Scale bars: 30 µm. A, atrium; AVC, atrioventricular canal; V, ventricle.