
Image
|
Figure Caption
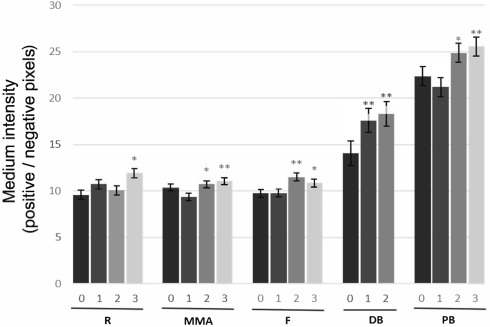
Fig. 6 Cellular apoptosis analysis using the acridine orange technique in zebrafish larvae at the 5 dpf stage. The bars express the mean ± standard error (n = 10) of experiments performed in triplicate for each subgroup. *p ≤ 0.05 and **p ≤ 0.01 in relation to the respective control of each group using one-way ANOVA, followed by the Tukey test. All groups showed a significant increase in apoptotic cells relative to their respective controls.
Acknowledgments
This image is the copyrighted work of the attributed author or publisher, and
ZFIN has permission only to display this image to its users.
Additional permissions should be obtained from the applicable author or publisher of the image.
Full text @ Heliyon