
|
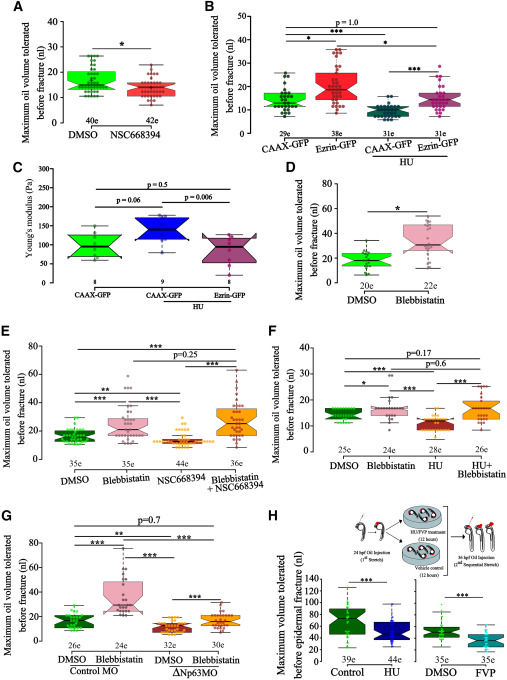
Fig. 5 Ezrin activity resists non-muscle myosin-II contractility to increase epidermal fracture strength (A and B) The boxplots represent the volume of injected oil tolerated before the epidermis fractures at 24 hpf after Ezrin inhibition using NSC668394 (A) or restoration of Ezrin in HU-treated embryos using Ezrin-GFP RNA injection (B). (C) The boxplot for AFM analysis indicates significant decrease in the Young’s modulus in HU-treated embryos that express Ezrin-GFP as compared to CAAX-GFP-injected controls. (D–H) Boxplots representing the changes in fracture strength upon myosin inhibition (D), combined inhibition of myosin and Ezrin (E), or combined inhibition of myosin and proliferation (HU treatment, F, or ΔNp63 knockdown, G). The sequential stretch paradigm (H), reveals a significant reduction in the magnitude of second stretch tolerated (as indicated by a reduction in the oil volume required to fracture the tissue) if proliferation is inhibited post first stretch using HU and FVP treatment (H). Quantification and statistical analyses were performed using n = the total number of embryos collected from multiple sets, as indicated below graphs (e, embryos). ∗p < 0.05, ∗∗p < 0.01, and ∗∗∗p < 0.001 by Mann-Whitney test. The statistical significance for the data presented in (E)–(G) was also evaluated by Kruskal-Wallis test with Dunn’s post hoc test (see Data S2), which is consistent with Mann-Whitney test with the exception of comparisons between DMSO versus NSC668394 (E) and DMSO and blebbistatin (F). The difference between the outcome of the two tests with respect to these two comparisons is possibly due to the variation in the data.