
|
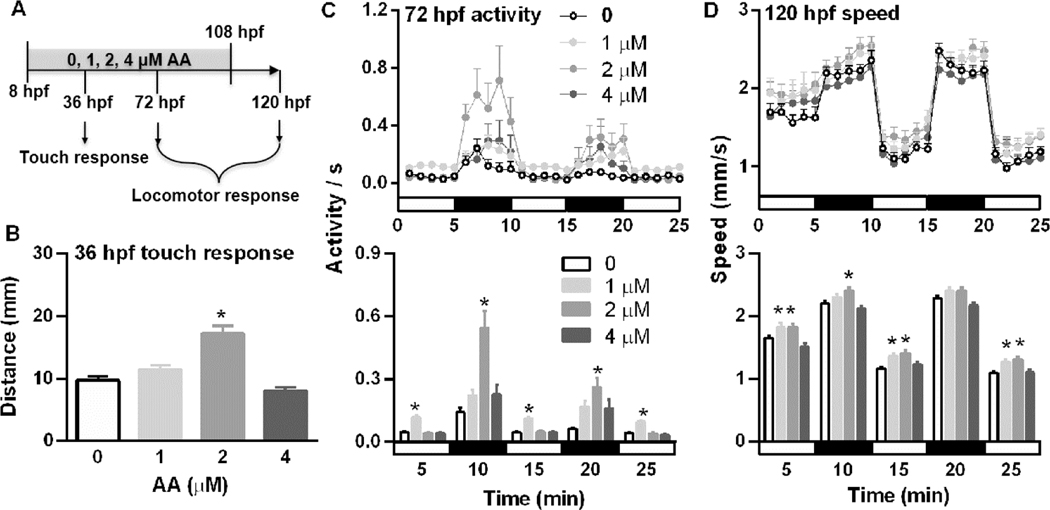
Fig. 2 Continuous AA exposure (8–108 hpf) affected larval motor behaviors. (A) A schematic diagram showing zebrafish embryos exposed to 0, 1, 2, and 4 μM AA from 8–108 hpf and sampled at various time points for different motor behavior. (B) Touch response of dechorionated embryos at 36 hpf (n = 24). (C, D) Locomotor response at 72 hpf (C) and 120 hpf (D). Black and white bars at the x-axis represent dark and light conditions, respectively. Dots are the mean activity (72 hpf) or speed (120 hpf) in 60 s intervals, and bars are mean activity or speed (mm/s) in 5-min intervals for each light condition (light or dark) (n = 24). Values are plotted as mean + SD. *P < 0.05 indicates significant differences from the vehicle control.