
|
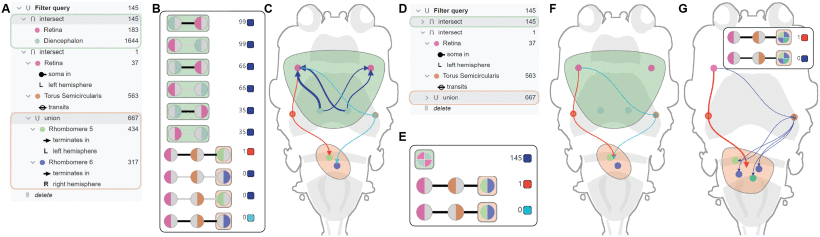
Fig. 6 Visual components (Section V). A: Query builder (Section V-A1), showing the example query; the selected sub-queries are highlighted by green and orange bounding boxes, respectively. B: Pathway browser (Section V-B1), displaying the list of possible connections realizing the example query. C: Circuit viewer (Section V-C1), showing the realized neural circuits and regions corresponding to selected sub-queries enclosed by an envelope. The thickness of the blue connections encodes to number of neurons. D: Query builder (Section V-A1), showing the collapsed sub-queries. E: Pathway browser (Section V-B1), displaying the list of partially aggregated pathways. F: Circuit viewer (Section V-C1), showing the pathways as partially aggregated edges. G: Circuit viewer (Section V-C1), depicting two different selection modes for partially aggregated pathways. In the default mode, the links to all regions in the corresponding set are shown, e.g., pathways in the right hemisphere. Alternatively, an aggregated representation of pathways, e.g., the red line leading to the orange region, is displayed as an aggregated edge.