
|
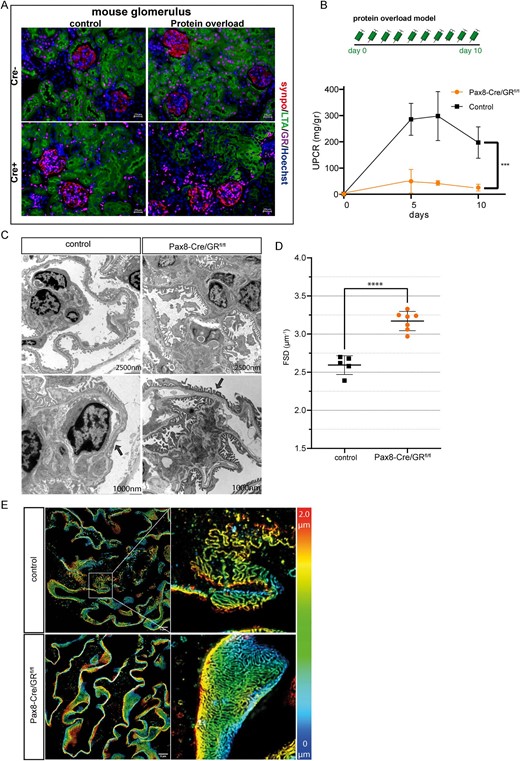
Fig. 2 Genetic Inactivation of glucocorticoid signaling and protein overload in these mice. (A) Immunofluorescence costaining of GR (magenta), podocyte marker synaptopodin (synpo; red), proximal tubule cells (LTA; red) and DNA (Hoechst; blue) confirmed the selective deletion of GR in renal epithelial cells. (B) Schme of the protein overload model. Proteinuria was induced by bovine albumin injections (15 mg/g/body weight daily for 10 days (n = 6 per group) (upper). UPCR in mg/g creatinine in wildtype mice (control) and transgenic mice (ko) following protein overload (n = 6 per group) (lower graph). (C) Transmission electron microscopy from wildtype control mice and transgenic mice with protein overload (Day 10). There is reduced podocyte effacement in transgenic mice compared with wildtype controls. (D) Quantification of slit diaphragm density width in wildtype control and transgenic mice. Data are expressed as means ± SD. ****P < .0001 by Student's t-test. (E) Images of 3D-reconstructed SIM volumes showing the spatial aspect of the slit diaphragm on the capillary loops in control and ko mice. The same colors indicate the same Z-position within the total Z-volume of 4.5 µm. Data are expressed as means ± SD. ***P < .001, ****P < .0001 by t-test and two-way ANOVA.