
|
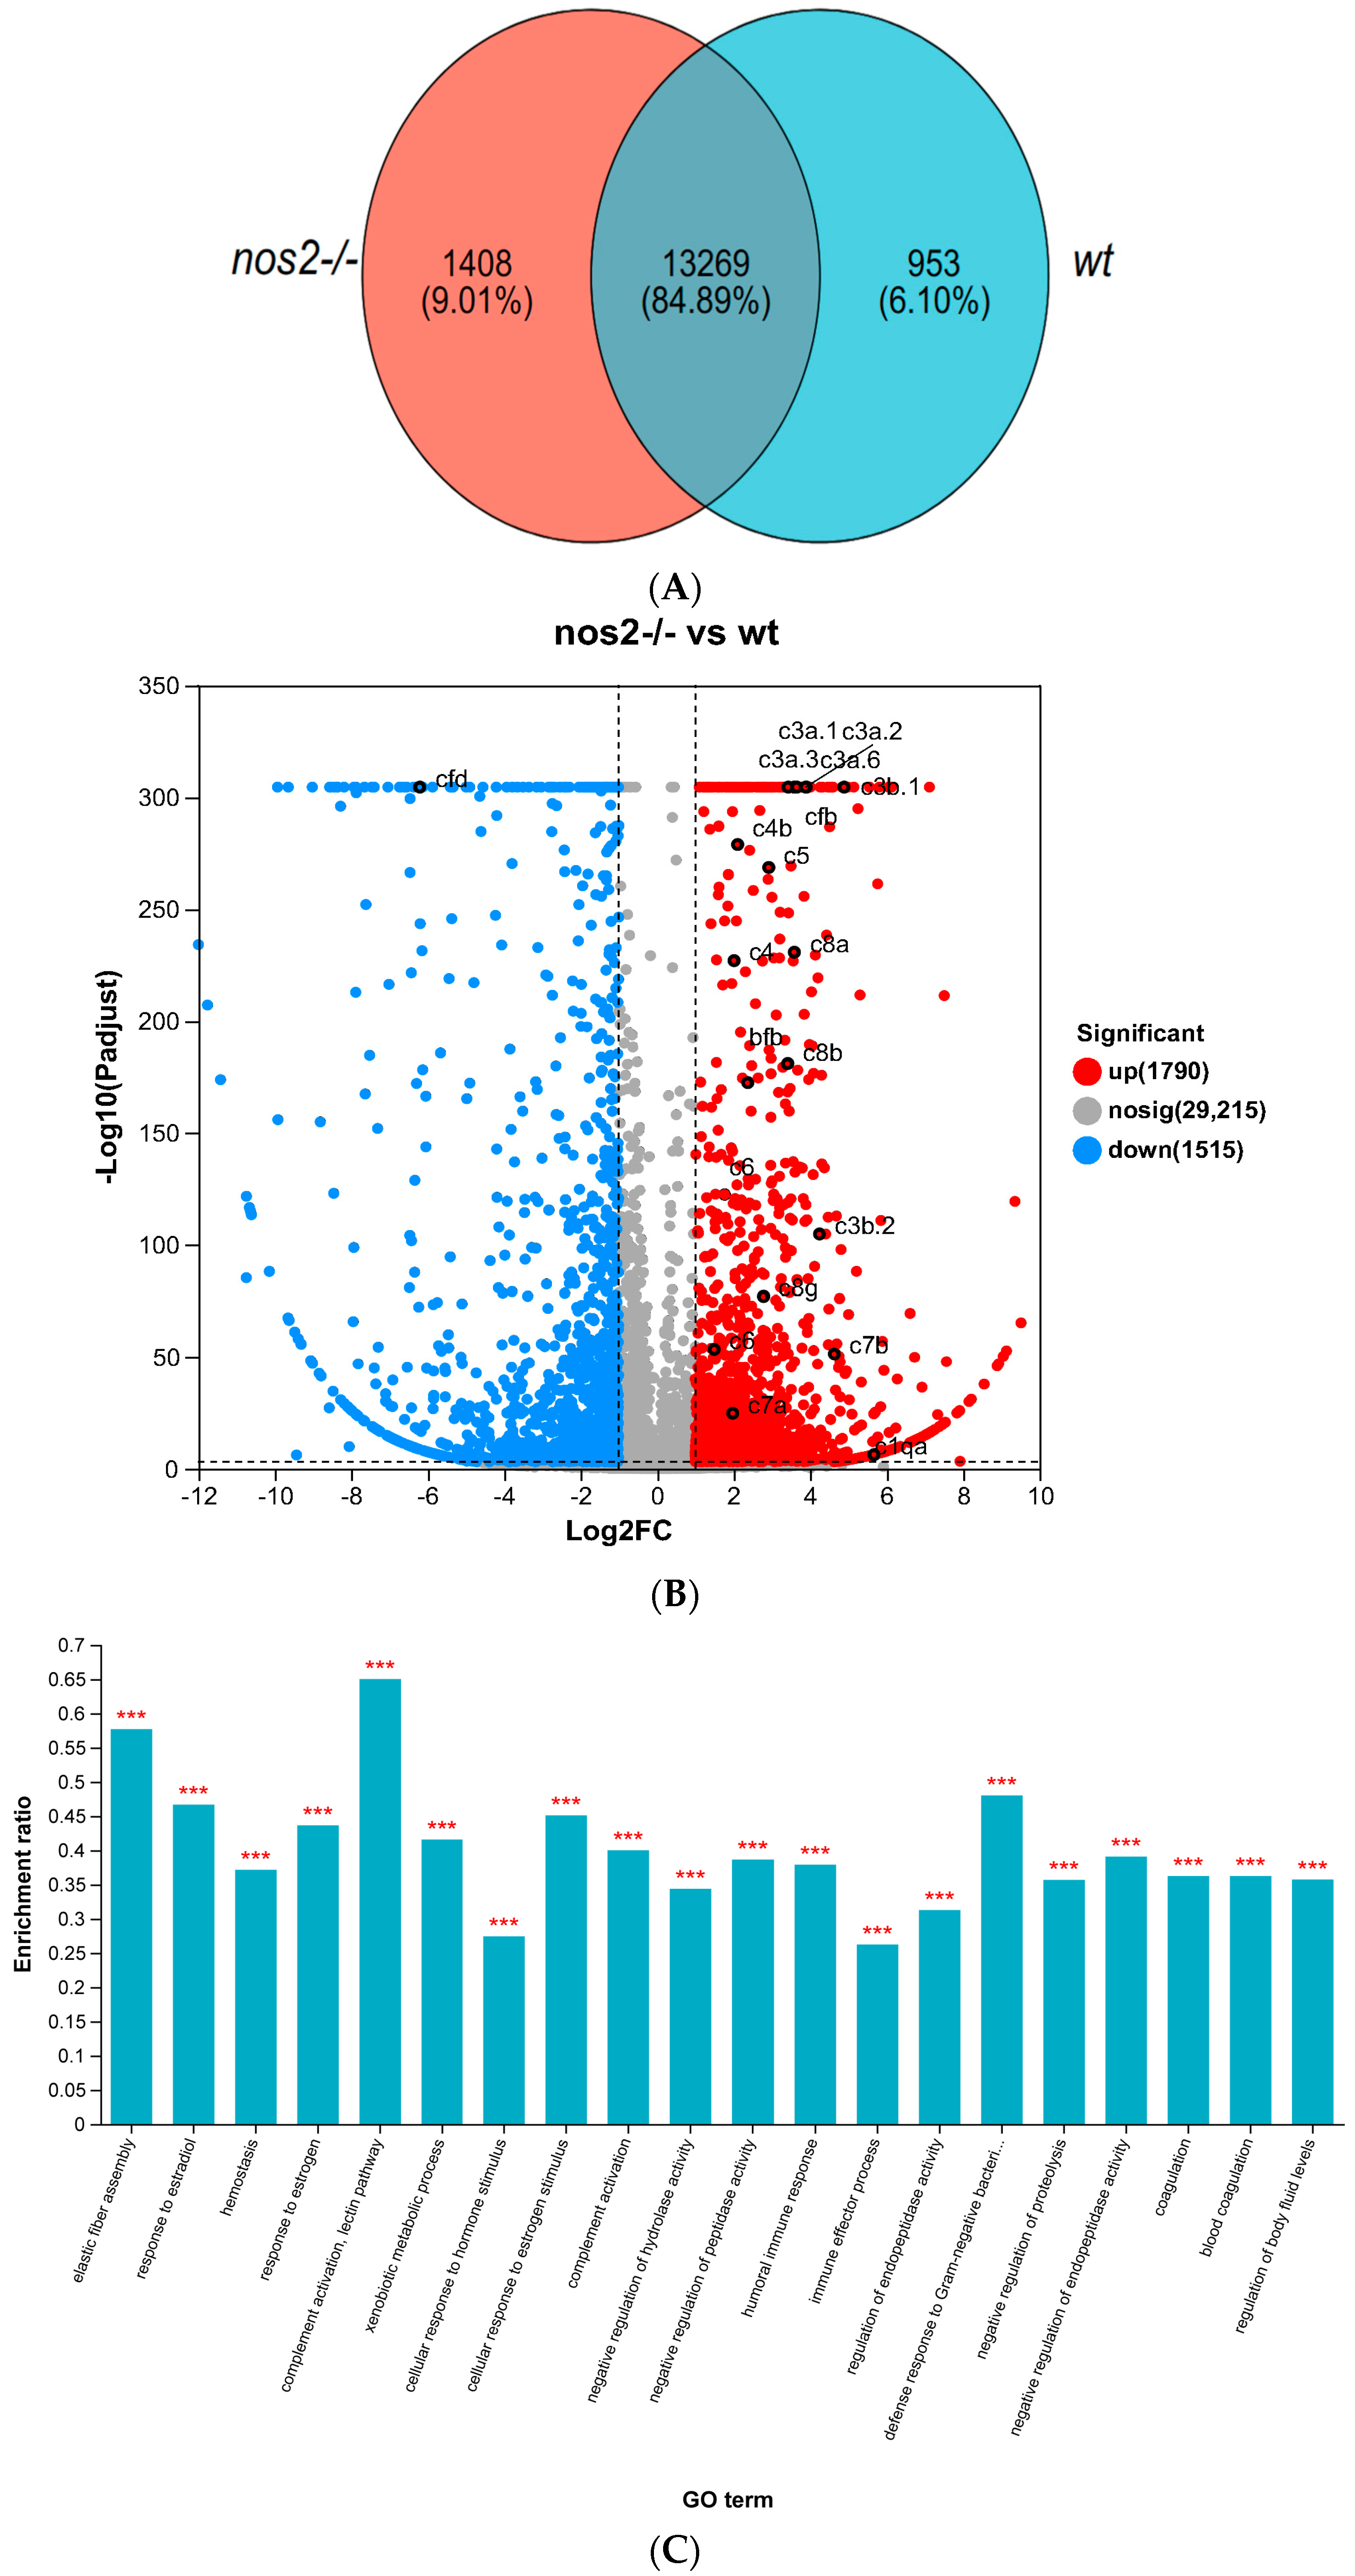
Fig. 5 Transcriptomic Sequencing of nos2−/− mutant and wild-type (WT) groups. Heatmap of differentially expressed genes associated with key metabolic and immune pathways. Expression levels are depicted as log2 fold change between knockout and wild-type groups. (A) Distribution of shared and unique genes between the nos2−/− mutant and the wild-type group (WT). (B) Number of differentially expressed genes between the nos2−/− mutant and the wild-type group (WT). (C) Gene ontology (GO) enrichment analysis, *** p <0.001. (D) Enrichment of pathways in the Kyoto Encyclopedia of Genes and Genomes (KEGG). All statistical analyses were conducted using R software version 3.6.1. Differences were considered significant at p < 0.05.