
Fig. 6
- ID
- ZDB-IMAGE-240627-17
- Publication
- Stagaman et al., 2024 - The zebrafish gut microbiome influences benzo[a]pyrene developmental neurobehavioral toxicity
- All Figures
- Figures for Stagaman et al., 2024
|
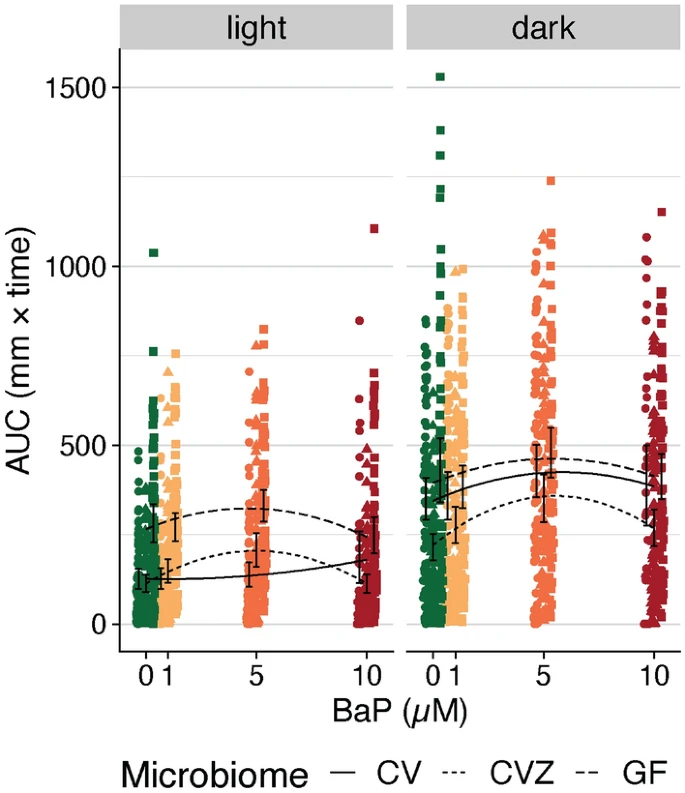
Fig. 6 LPR movement areas under the curve (AUCs) split by light and dark. Colors represent each BaP exposure level (in µM). The black lines indicate the estimated association from polynomial linear regression, where line type corresponds to the microbiome’s state in a fish (i.e., conventional (CV), conventionalized (CVZ), or germ free (GF)). Black error bars indicate the 95% C.I.s for the mean AUC per BaP exposure level and microbiome treatment. For the light cycle, GF sample AUCs are significantly higher than CV AUCs, and there is no significant difference between CVZ AUCs and CV AUCs. There is a significant interaction between microbiome state and the second order of BaP concentration (Supp. Table 8). For the dark cycle, CVZ sample AUCs are significantly lower than CV AUCs, and there is no significant difference between GF AUCs and CV AUCs. There is no significant interaction term between microbiome state and BaP in a polynomial linear regression (Supp. Table 8).