
|
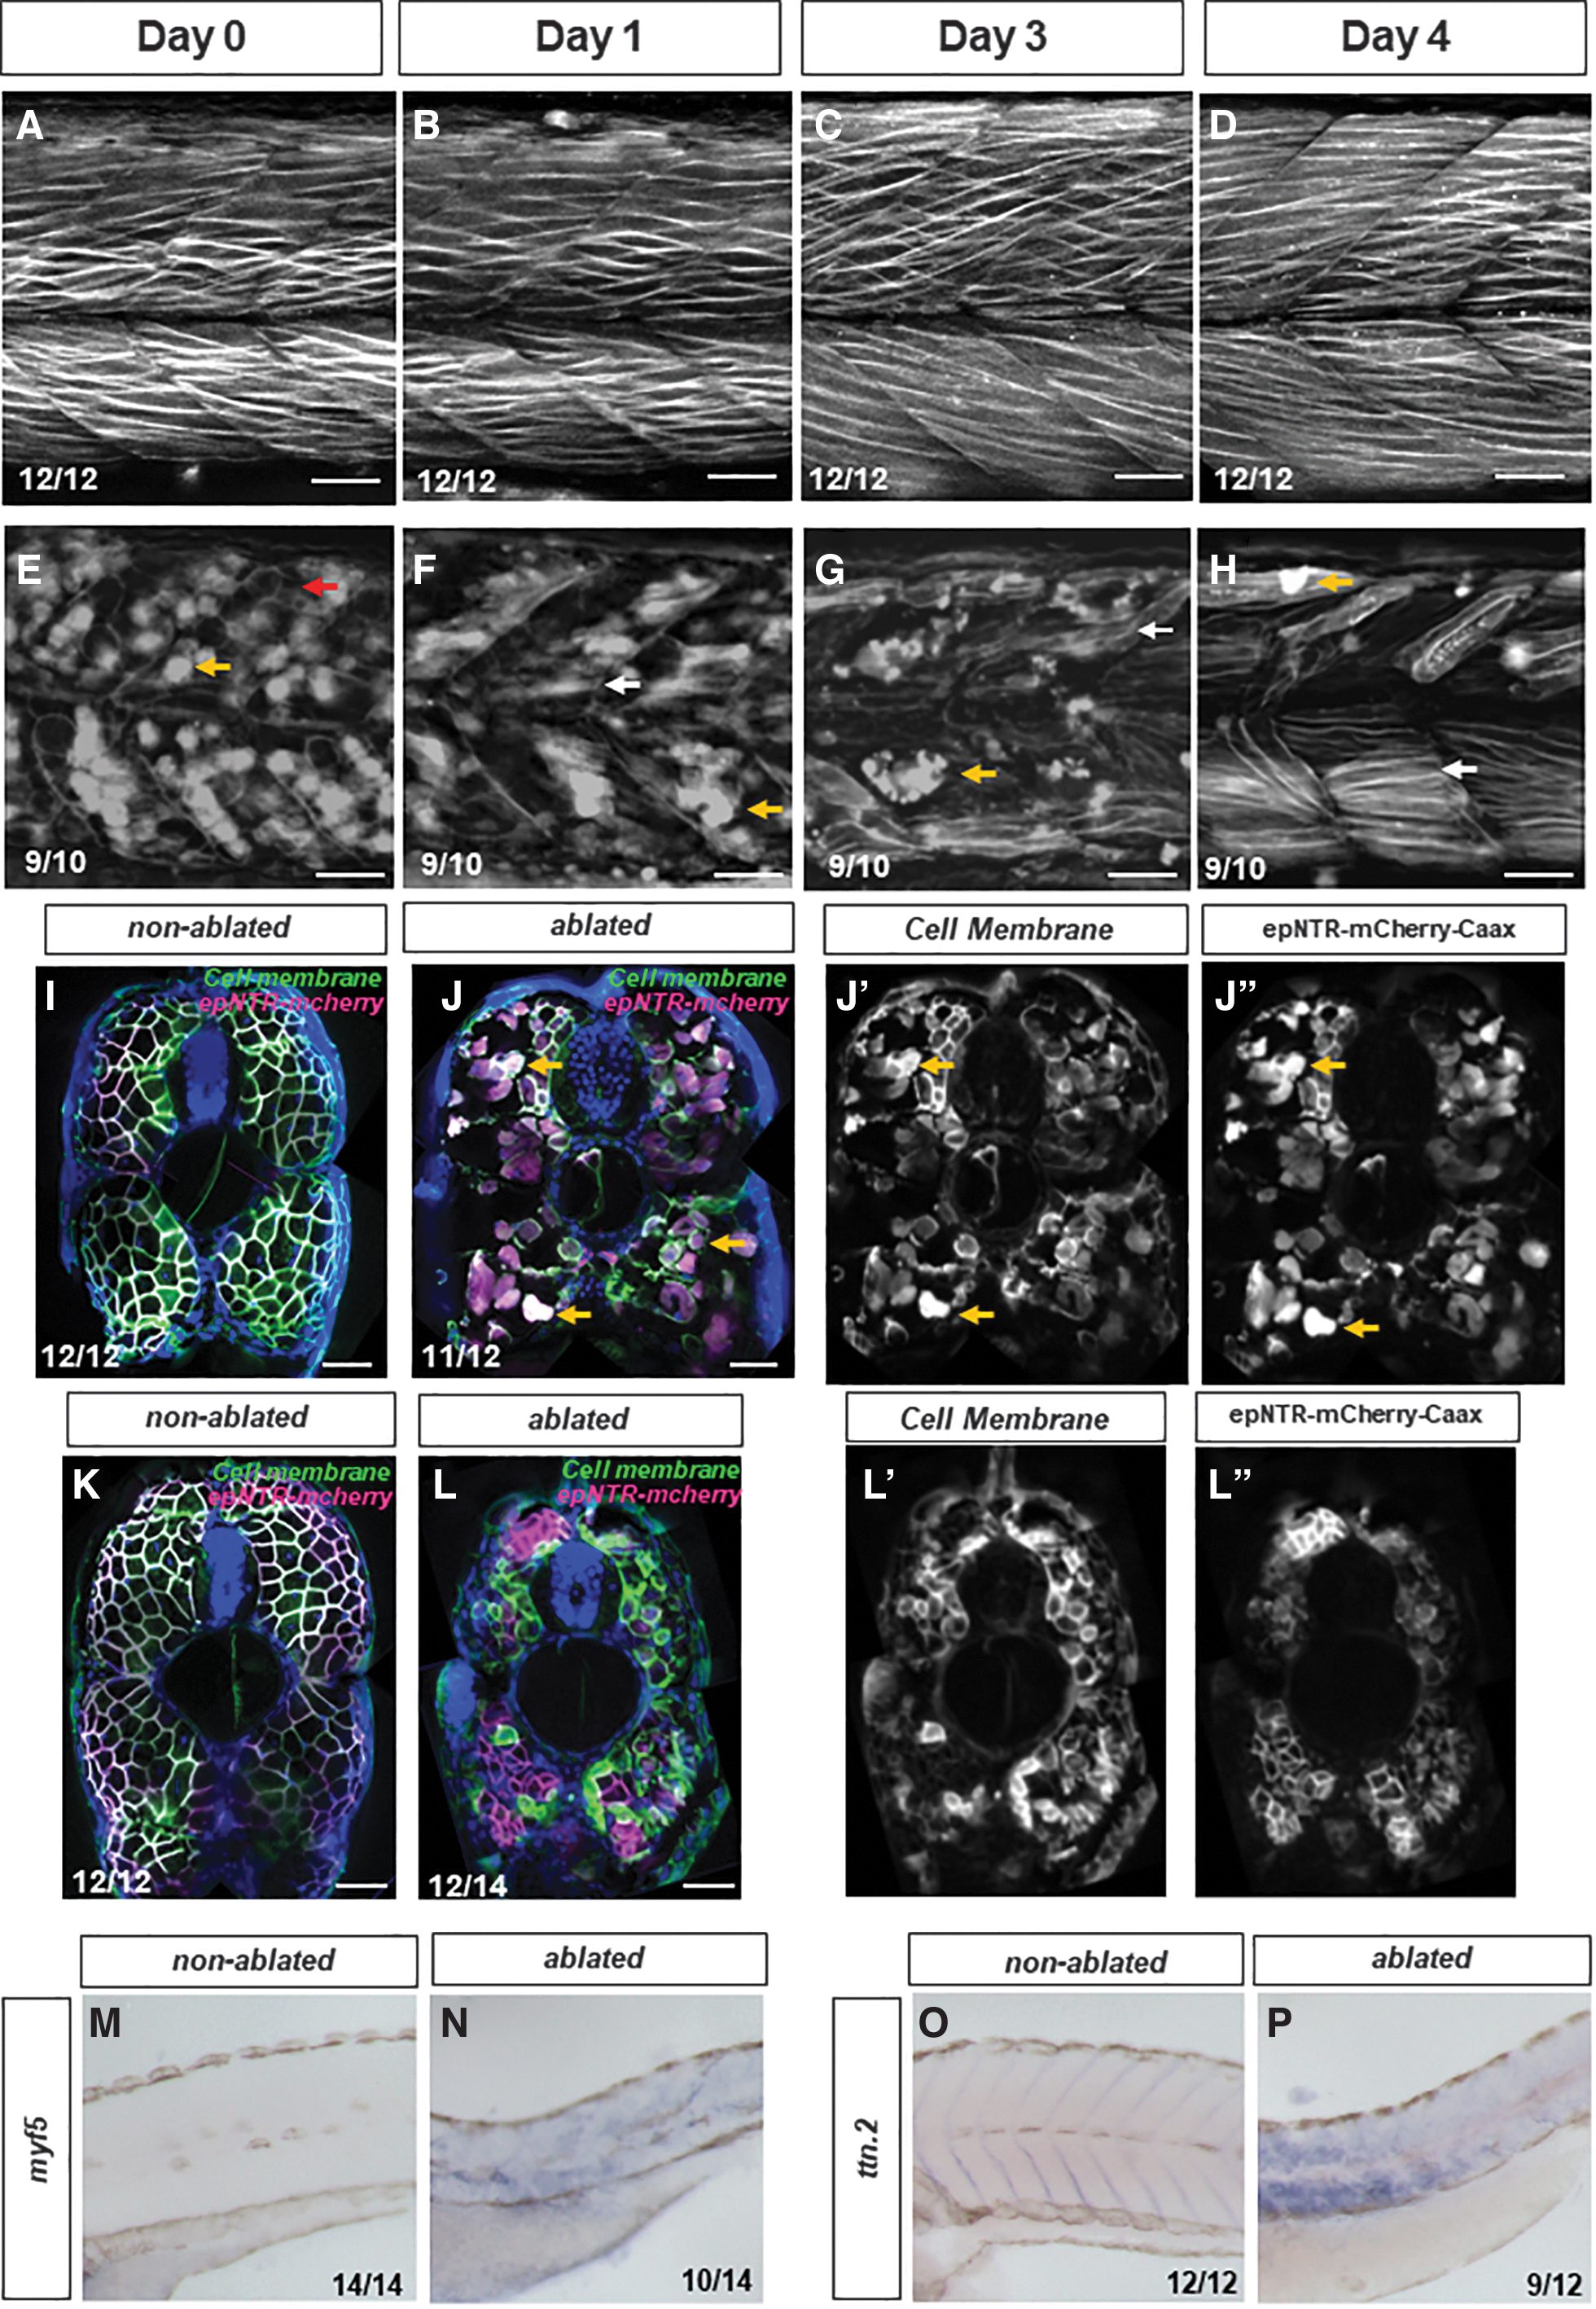
Fig. 2 Ablated muscle tissue regenerates after MTZ is washed out. (A–D) Images of mCherry fluorescence in actc1b:epNTR embryos treated with DMSO vehicle at 1 dpf for 30 h followed by washout. (E–H) Images of mCherry fluorescence in actc1b:epNTR embryos treated with 10 mM MTZ at 1 dpf for 30 h followed by washout. The number of days following washout are indicated in the figure. (I–L) Cross-sections of embryos containing both the tg(ubi:mNG-lck) and tg(actc1b:epNTR-mcherry-caax) transgenes treated with DMSO (I) or MTZ (J) immediately after MTZ treatment (I, J) or 2 days after MTZ washout (K, L). Magenta indicates epNTR-mCherry-caax. Green indicates membrane localized mNeonGreen. Blue indicates DAPI. Yellow arrows (J) indicate an ablated cells with auto fluorescence, white arrows show regenerated muscle fibers, and the red arrow shows a cell-free gap that has formed. (J’, J’’, K–L’’) The green and magenta channels representing the different transgenes are shown separately. Scale Bars = 50 μM. (M, N) In situ hybridization for myf5 in DMSO (M) or MTZ (N) treated actc1b:epNTR embryos. (O, P) In situ hybridization for ttn.2 in DMSO (O) or MTZ (P) treated actc1b:epNTR embryos.