
Image
|
Figure Caption
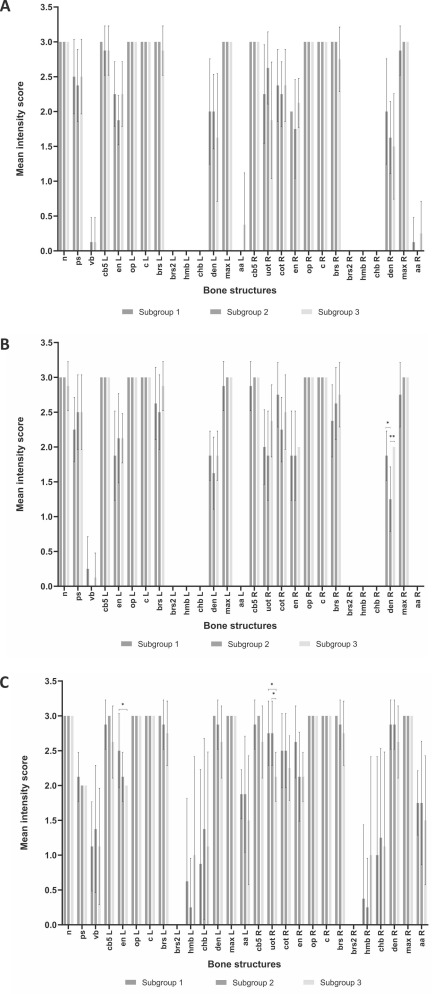
Fig. 22 Variability in staining between subgroups of the same batch of control larvae. In A) the results of batch 1 are shown, in B) the results of batch 2 are shown and in C) the results of another batch (i.e., the solvent control group of the second replicate of the compound 5 experiment at 5 dpf) are shown. For each of these batches, the batch was divided into 3 subgroups of 8 fish. All the subgroups of a batch were compared to each other. Significant differences between the three subgroups are indicated. P ≤ 0.05 (*) and p ≤ 0.01 (**).
Acknowledgments
This image is the copyrighted work of the attributed author or publisher, and
ZFIN has permission only to display this image to its users.
Additional permissions should be obtained from the applicable author or publisher of the image.
Reprinted from Reproductive toxicology (Elmsford, N.Y.), 127, Hoyberghs, J., Ball, J., Trznadel, M., Beekhuijzen, M., Burbank, M., Wilhelmi, P., Muriana, A., Powles-Glover, N., Letamendia, A., Van Cruchten, S., Biological variability hampers the use of skeletal staining methods in zebrafish embryo developmental toxicity assays, 108615, Copyright (2024) with permission from Elsevier. Full text @ Reprod. Toxicol.