IMAGE

Fig. 6

ID
ZDB-IMAGE-240623-6
Source
Figures for Hu et al., 2024
Image
Figure Caption

Fig. 6

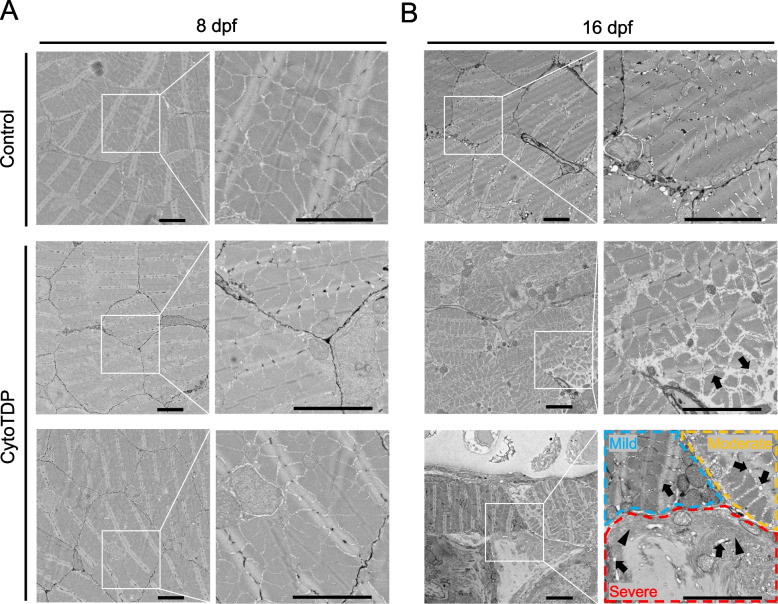
Mislocalization of endogenous TDP-43 causes muscle atrophy. A Representative electron microscopy (EM) images for CytoTDP and Control skeletal muscle at 8 dpf. CytoTDP have well-organized myofibrils and no obvious muscle atrophy at 8 dpf compared to Control. B Representative EM images for CytoTDP and Control skeletal muscle at 16 dpf. 16 dpf CytoTDP have a dilated sarcoplasmic reticulum (SR) (arrows) and significant muscle atrophy. Mildly affected muscle fiber (blue circled area) shows slightly dilated SR. Moderately affected muscle fiber (orange circled area) shows dilated SR. Severely affected muscle fiber (red circled area) shows dilated SR and severely misarranged cytoplasmic structures (arrowhead) (Scale bar = 5 μm)

Acknowledgments
This image is the copyrighted work of the attributed author or publisher, and ZFIN has permission only to display this image to its users. Additional permissions should be obtained from the applicable author or publisher of the image. Full text @ Mol. Neurodegener.