IMAGE

Fig. 1

ID
ZDB-IMAGE-240623-1
Source
Figures for Hu et al., 2024
Image
Figure Caption

Fig. 1

Biochemical characterization of ΔNLS-Tardbp fish.
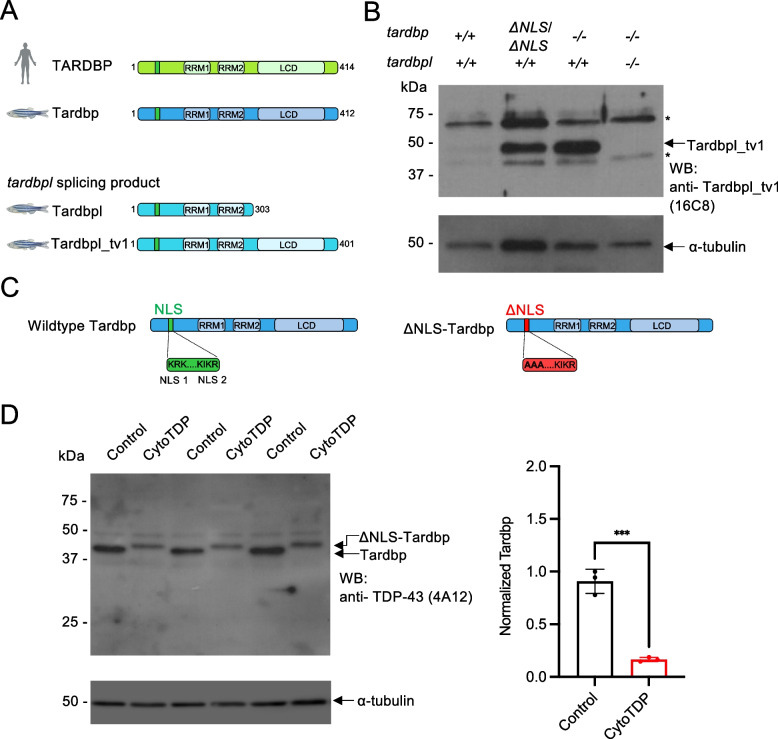
 A Schematic drawing shows splicing products from zebrafish 2 orthologs of human TARDBP, tardbp and tardbpl. Zebrafish Tardbp has 2 RNA recognition motifs (RRM1 and RRM2) and a low-complexity domain (LCD). Tardbpl and Tardbpl_tv1 are splicing products from the tardbpl gene. While zebrafish Tardbpl does not have a low-complexity domain, zebrafish Tardbpl_tv1 has 2 RNA recognition motifs (RRM1 and RRM2) and a low-complexity domain. B Western blot analysis with the Tardbpl_tv1 specific antibody 16C8 detects Tardbpl_tv1 levels to be upregulated in tardbp ΔNLS/ΔNLS and tardbp -/- embryos compared to wildtype embryos. TDP DKO larvae in lane 4 serve as a control for the specificity of the Tardbpl_tv1 antibody. Asterics mark unspecific bands. α-tubulin serves as a loading control. C Schematic drawing highlights bipartite nuclear localization sequence (NLS) in zebrafish Tardbp. The ΔNLS-Tardbp mutation was generated in NLS1 by mutating the amino acids KRK to AAA. D Western blot analysis of 3 biological replicates with the Tardbp antibody 4A12 detects reduced Tardbp levels and a band shift to a higher molecular weight in CytoTDP embryos compared to Control (tardbp + / + ; tardbpl -/-) embryos. Semi-quantitative analysis of the Western blots revealed that the Tardbp levels normalized to α-tubulin in 5 dpf CytoTDP embryos (n = 3) are only 18% compared to Control (n = 3) (***p = 0.0004, Unpaired T test)

Acknowledgments
This image is the copyrighted work of the attributed author or publisher, and ZFIN has permission only to display this image to its users. Additional permissions should be obtained from the applicable author or publisher of the image. Full text @ Mol. Neurodegener.