IMAGE

Fig. 3

ID
ZDB-IMAGE-240621-73
Source
Figures for Wilson et al., 2024
Image
Figure Caption

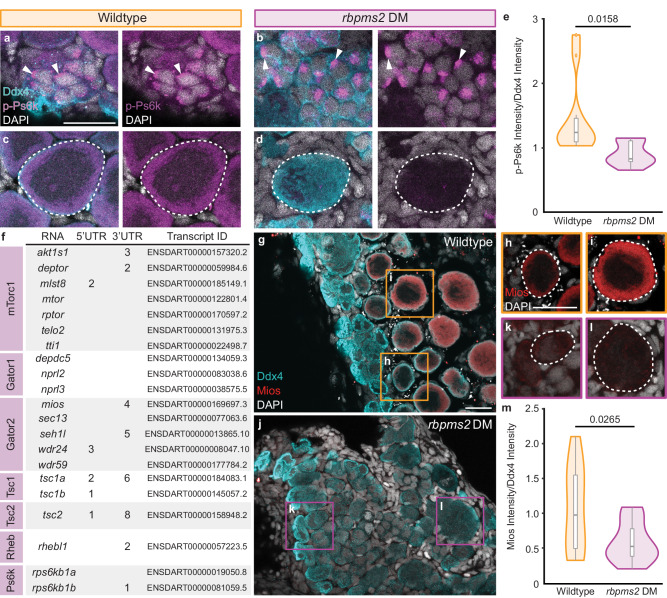
Fig. 3 Rbpms2 functions upstream of the Gator2 complex protein, Mios.

ad Immunostaining of p-Ps6k (purple) in 29-33 dpf wildtype (rbpms2aae30; rbpms2bsa9329 heterozygous mutant; n = 4) and rbpms2 DM (rbpms2aae30; rbpms2bsa9329 double homozygous mutant; n = 4) germ cells. Germ cells are labeled with Ddx4 (teal) and nuclei are labeled with DAPI (white). a, b Arrows indicate p-Ps6k localization in mitotic and early meiotic nuclei. c, d Dashed lines indicate early oocytes. Adjacent panel shows p-Ps6k and DAPI localization in indicated cells. Scale bar is 20 µM. e Quantification of the p-Ps6k intensity normalized to the intensity of Ddx4 for wildtype (rbpms2aae30; rbpms2bsa9329 heterozygous mutant; n = 10 cells from 3 individual fish) and rbpms2 DM (rbpms2aae30; rbpms2bsa9329 homozygous mutant; n = 9 cells from 3 individual fish) oocytes. Two-tailed paired equal variance Student’s t tests were performed for the indicated groups. P = 0.05. f Table of mTorc1-related components with predicted Rbpms binding sites22 in their 3′ and/or 5′ UTRs. Transcript IDs evaluated for each component are listed and purple boxes indicate the protein component or complex of the pathway a given factor belongs to. gl Immunostaining for Mios (red) in 29-31 dpf wildtype (rbpms2aae30; rbpms2bsa9329 heterozygous mutant, n = 4) and rbpms2 DM (rbpms2aae30; rbpms2bsa9329 double homozygous mutant; n = 4) germ cells. Germ cells are labeled with Ddx4 (teal) and nuclei are labeled with DAPI (white). hl Dashed outline indicates oocytes and shows Mios and DAPI localization in indicated cells. Scale bar is 20 µM. m Quantification of the intensity of Mios normalized to the intensity of Ddx4 for wildtype (rbpms2aae30; rbpms2bsa9329 heterozygous mutant; n = 11 cells from 3 individual fish) and rbpms2 DM (rbpms2aae30; rbpms2bsa9329 double homozygous mutant; n = 11 cells from 3 individual fish) oocytes. Two-tailed paired equal variance student’s t tests were performed for the indicated groups. P = 0.05. e, m For box and whisker plots, line indicates median, boxes indicate upper (75th) and lower quartiles (25th), whiskers indicate data within 1.5 times the inner quartile range, and error bars represent minimum and maximum values. Any data outside of this range are plotted as individual points. Source data are provided as a Source Data file.

Acknowledgments
This image is the copyrighted work of the attributed author or publisher, and ZFIN has permission only to display this image to its users. Additional permissions should be obtained from the applicable author or publisher of the image. Full text @ Nat. Commun.