
|
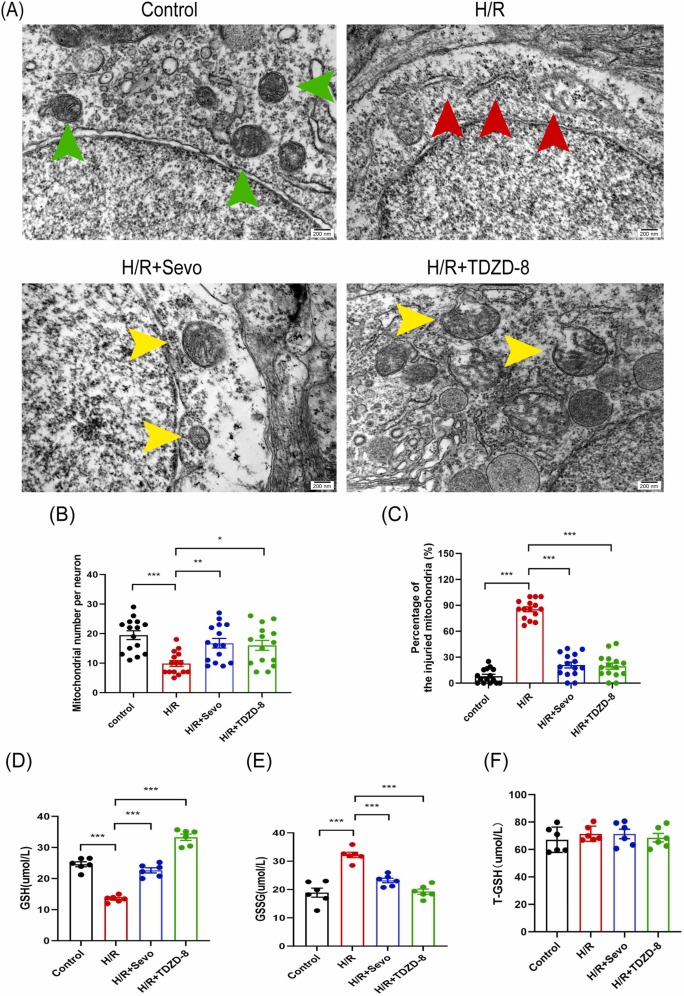
Fig. 4 Ultrastructural morphology of mitochondria and oxidative stress in zebrafish brain. (A) Representative transmission electron microscopy images of mitochondria in zebrafish brains from the control, H/R, H/R + Sevo, and H/R + TDZD-8 groups. Green arrows indicate healthy mitochondria, red arrows indicate injured mitochondria, and yellow arrows indicate partially restored mitochondria in terms of morphology. Scale bar = 200 nm. (B-C) The quantification of mitochondrial number and the percentage of injured mitochondria in the zebrafish brains conducted using electron microscopy, with a sample size of 15 neurons in five zebrafish per group. (D-F) Levels of glutathione (GSH), oxidized glutathione (GSSG), and total GSH (T-GSH) in zebrafish brain measured under hypoxia, sevoflurane postconditioning, and TDZD-8 pretreatment, with six brains included in each group. Data are expressed as mean ± S.E.M. The significance levels were * p < 0.05, **p < 0.01, and ***p < 0.001, with analyzed by one-way ANOVA followed by Tukey’s multiple comparison test.