
Image
|
Figure Caption
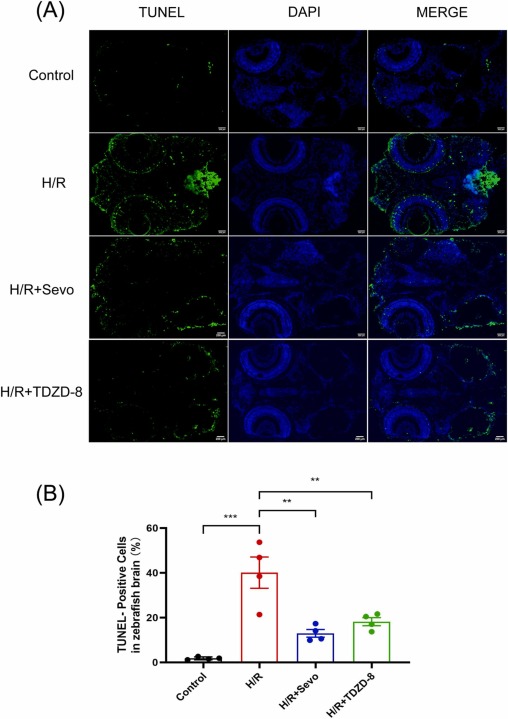
Fig. 3 Apoptosis in zebrafish brains. (A) Representative images of horizontal sections of zebrafish brain in control, H/R, H/R + Sevo, and H/R + TDZD-8 groups. From the left to the right: TUNEL-positive images, DAPI-positive images, and the merged images. (B) Statistical analysis of TUNEL-positive regions in zebrafish brains, with four brains included in each group. Data are expressed as mean ± S.E.M. Scale bar =100 μm. The significance levels were ** p < 0.01 and *** p < 0.001, with analyzed by one-way ANOVA followed by Tukey’s multiple comparison test.
Acknowledgments
This image is the copyrighted work of the attributed author or publisher, and
ZFIN has permission only to display this image to its users.
Additional permissions should be obtained from the applicable author or publisher of the image.
Full text @ Biomed. Pharmacother.