
|
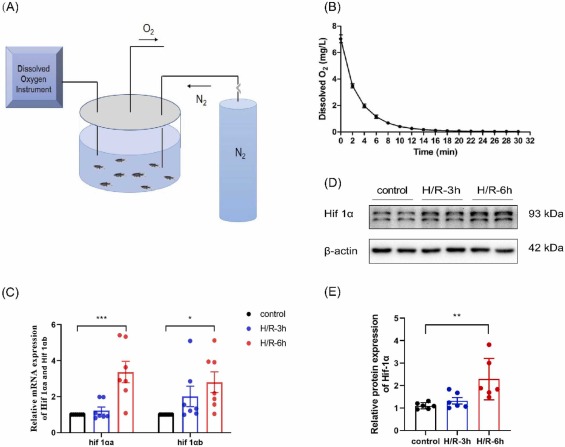
Fig. 1 Experimental setup of the hypoxia-reoxygenation brain damage model in zebrafish through oxygen deprivation. (A) A simulation diagram of the hypoxia device designed for zebrafish. (B) The dissolved oxygen levels in the hypoxic aquarium gradually declined as nitrogen perfusion increased, ultimately reaching the lowest level of 0.145 mg/L at the 16th minute. (C) qRT-PCR analysis demonstrated a significant up-regulation in mRNA levels of hif-1αa and hif-1αb following a 6-h H/R (H/R-6 h) treatment. (D) Western blotting revealed a notable elevation in Hif-1α protein level after 6-h H/R treatment. H/R-3 h: hypoxia followed by 3 h of reoxygenation; H/R-6 h: hypoxia followed by 6 h of reoxygenation. Six to seven brains were analyzed per group. Data are shown as mean ± S.E.M. Statistical significance is denoted as ∗ p < 0.05, ∗∗ p < 0.01, and ∗∗∗ p < 0.001 compared to the control.