
Fig. 4
- ID
- ZDB-IMAGE-240620-151
- Publication
- Marchese et al., 2024 - Targeting autophagy impairment improves the phenotype of a novel CLN8 zebrafish model
- All Figures
- Figures for Marchese et al., 2024
|
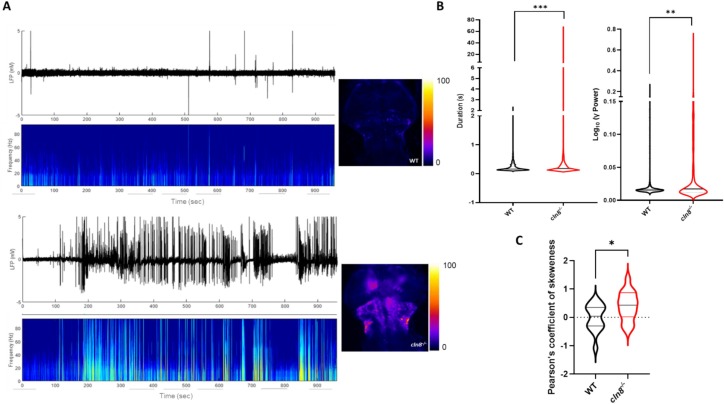
Fig. 4 Electroencephalographic recordings and brain calcium imaging in cln8−/− mutants. (A) The images on the left show the local field potential (LFP) traces of 5 dpf WT and cln8−/− larvae with (below) the power spectrum calculated in the 30–95 Hz passband lasting 16 min. On the right, the representative z-projection images of the brain calcium imaging performed in the larvae in 16 min of recording (see calcium fluorescence heatmap). (B) LFP analysis using MATLAB software. The graphs represent the duration and power of identified events in 15 WT and 15 cln8−/− fish. (C) Analysis of calcium imaging was performed by calculating Pearson's coefficient of skewness in the two groups. Statistical analysis was performed using the Mann-Whitney test (****p ≤ 0.0001; ***p ≤ 0.001; **p ≤ 0.01; *p ≤ 0.05). Violin plots show the median and quartiles.