
Fig. 3
- ID
- ZDB-IMAGE-240620-149
- Antibodies
- Publication
- Marchese et al., 2024 - Targeting autophagy impairment improves the phenotype of a novel CLN8 zebrafish model
- All Figures
- Figures for Marchese et al., 2024
|
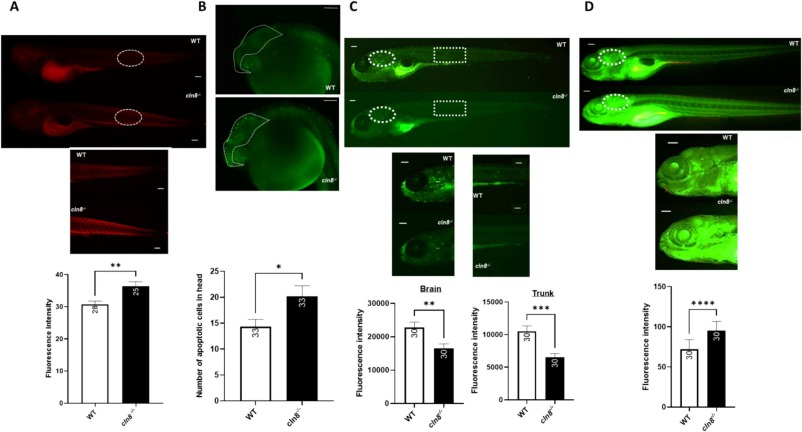
Fig. 3 Evaluation of the pathological signs of NCL in cln8−/− mutants. (A) Immunofluorescence analysis of subunit c of mitochondrial ATP synthase (SCMAS) in 5 dpf WT and cln8−/−embryos. (B) Acridine orange staining in brains of mutant and control 24 hpf embryos. (C) Lysotracker in vivo staining in 5 dpf WT and cln8−/− larvae. (D) Bodipy staining in live 5 dpf mutant and control larvae. Three independent experiments were performed in each group: cln8−/− and controls. Statistical analysis was performed using the Mann-Whitney test (****p ≤ 0.0001; ***p ≤ 0.001; *p ≤ 0.05). (scale bar = 100 μm). The number inside the bars is the sample size. The values are expressed as mean ± standard error of the mean (SEM).