
|
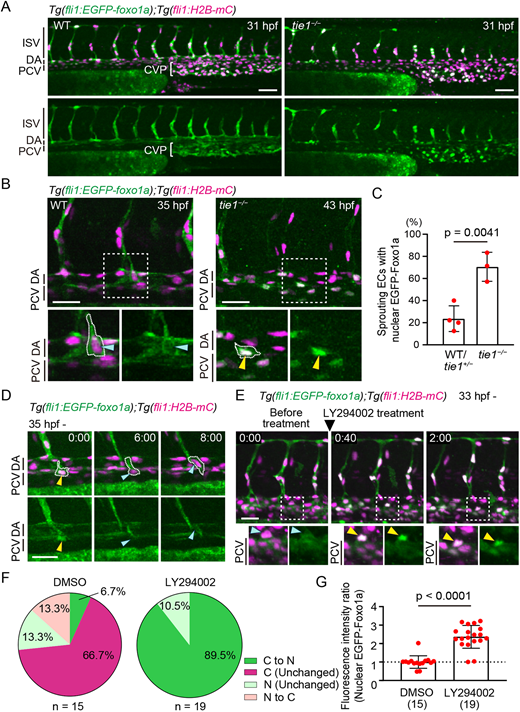
Fig. 6 Tie1 inhibits nuclear import of Foxo1a during secondary sprouting. (A) Trunk and tail of Tg(fli1:EGFP-foxo1a);Tg(fli1:H2B-mCherry) WT and tie1−/− embryos (31 hpf). (B) Trunk of Tg(fli1:EGFP-foxo1a);Tg(fli1:H2B-mCherry) WT (35 hpf) and tie1−/− embryos (43 hpf). The boxed areas are enlarged beneath. White dotted lines outline ECs sprouting from the PCV. Blue and yellow arrowheads indicate EGFP-Foxo1a in the cytoplasm and nucleus, respectively. (C) Quantitative analysis of the data shown in B. The graph shows the percentage of secondary sprouting ECs with nuclear EGFP-Foxo1a among total sprouting ECs from the PCV and CVP. Each dot represents an individual embryo. Data are mean±s.d. (WT/tie1+/−, n=4 embryos; tie1−/−, n=3 embryos). Six to ten sprouting ECs were measured in each embryo. (D) Time-sequential images of the trunk of a Tg(fli1:EGFP-foxo1a);Tg(fli1:H2B-mCherry) WT embryo from 35 hpf. Elapsed time (h:min). White dotted lines outline an EC sprouting from the PCV. Before nuclear migration, EGFP-Foxo1a was exported from the nuclei (yellow arrowheads) to the cytoplasm (blue arrowheads). (E) Time-sequential images of the trunk of a Tg(fli1:EGFP-foxo1a);Tg(fli1:H2B-mCherry) embryo (from 33 hpf) treated with 30 µM LY294002 just after the z-stack imaging at 0:00. Elapsed time (h:min). The boxed areas are enlarged beneath. Treatment with LY294002 altered the localization of EGFP-Foxo1a in a secondary sprouting EC from cytoplasmic (blue arrowheads) to nuclear (yellow arrowheads), leading to retraction of the sprouts. (F) Percentage of ECs in which EGFP-Foxo1a localization was unchanged or changed between cytoplasm (C) and nucleus (N) in secondary sprouting ECs after DMSO or LY294002 treatment. Tg(fli1:EGFP-foxo1a);Tg(fli1:H2B-mCherry) embryos were treated with DMSO or 30 µM LY294002 at 34 hpf during time-lapse imaging and localization changes examined before treatment (34 hpf) and 2 h after treatment (36 hpf) (DMSO, n=15 secondary sprouts; LY294002, n=19 secondary sprouts). (G) Fluorescence intensity of nuclear EGFP-Foxo1a in individual secondary sprouting ECs was quantified before treatment (34 hpf) and 2 h after treatment with DMSO or 30 µM LY294002 (36 hpf). The fluorescence intensity at 2 h after treatment was expressed relative to that before treatment. Scale bars: 50 μm (A); 30 µm (B,D,E). P-values were determined by two-tailed Student's t-test. CVP, caudal vein plexus.