
|
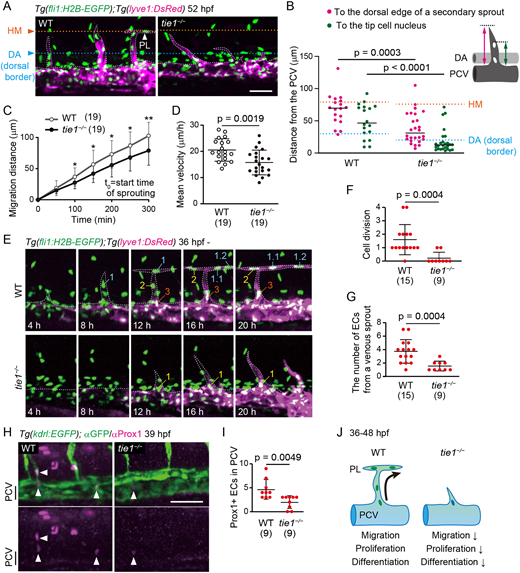
Fig. 4 zTie1 regulates migration, proliferation and differentiation of sprouting ECs from the PCV. (A) Trunk of Tg(fli1:H2B-EGFP);Tg(lyve1:DsRed) WT and tie1−/− embryos (52 hpf). Orange, cyan and white dotted lines indicate horizontal myoseptums (HM), dorsal borders of the dorsal aorta (DA), and outlines of lyve1:DsRed-positive venous ECs, respectively. (B) Distance from the dorsal edge of the PCV to the dorsal edge of a secondary sprout (magenta dots) and to the tip cell nucleus (green dots) in WT and tie1−/− embryos at 52 hpf. Data are mean±s.d. (WT, n=18 sprouts in 4 embryos; tie1−/−, n=26 sprouts in 7 embryos). (C) Total distance traveled by the tip cell nucleus at each time point from the initiation of venous sprouting. Start time of sprouting (t=0) was 40.0±3.7 hpf in WT and 42.7±4.5 hpf in tie1 mutant. Data are mean±s.d. (WT, n=19 sprouts in 3 embryos; tie1−/−, n=19 sprouts in 4 embryos). *P<0.05; **P<0.01. (D) Mean velocity of the tip cell nucleus during the first 300 min of venous sprouting. Data are mean±s.d. (WT, n=19 sprouts in 3 embryos; tie1−/−, n=19 sprouts in 4 embryos). (E) Time-sequential images of the trunk of Tg(fli1:H2B-EGFP);Tg(lyve1:DsRed) WT and tie1−/− embryos from 36 hpf (when secondary sprouting starts in WT). White dotted lines outline lyve1:DsRed-positive ECs. (F) Number of cell divisions in a venous sprout from 36 to 56 hpf. Data are mean±s.d. (WT, n=15 sprouts in 4 embryos; tie1−/−, n=9 sprouts in 7 embryos). (G) Number of ECs from a venous sprout at 56 hpf. Data are mean±s.d. (WT, n=15 sprouts in 4 embryos; tie1−/−, n=9 sprouts in 7 embryos). (H) Whole-mount immunofluorescence staining for Prox1 (magenta) and GFP (green) in WT and tie1−/− Tg(kdrl:EGFP) embryos at 39 hpf. Arrowheads indicate Prox1-positive ECs. (I) Number of Prox1-positive ECs in the PCV across six segments at 39 hpf. Data are mean±s.d. (WT, n=9 embryos; tie1−/−, n=9 embryos). (J) During the process of lymphangiogenesis, ECs (green ovals) budding from the PCV migrate, proliferate, and undergo lymphatic differentiation. In contrast, all of these cell behaviors are inhibited in tie1 mutants. Scale bar: 50 μm. P-values were determined by two-tailed Student's t-test.