
IMAGE
Fig. 5
- ID
- ZDB-IMAGE-240618-64
- Publication
- Chen et al., 2024 - gys1 regulates maternal glycogen reserve essential for embryonic development in zebrafish
- All Figures
- Figures for Chen et al., 2024
Image
|
Figure Caption
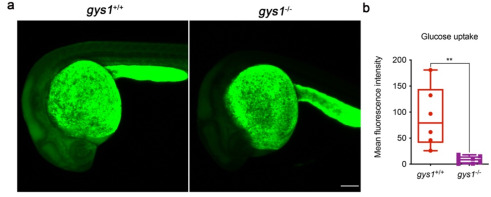
Fig. 5 The glucose uptake ability is reduced in F3 gys1 mutant embryos. (a) Representative images showing the glucose uptake after microinjection of 2-NBDG in embryos. (b) Average fluorescent intensity analysis of glucose uptake (gys1WT n = 6, gys1MT n = 7, **p < 0.01). Unpaired t-test was used as the statistical analysis.
Figure Data
Acknowledgments
This image is the copyrighted work of the attributed author or publisher, and
ZFIN has permission only to display this image to its users.
Additional permissions should be obtained from the applicable author or publisher of the image.
Full text @ Heliyon