
Fig. 3
- ID
- ZDB-IMAGE-240618-62
- Publication
- Chen et al., 2024 - gys1 regulates maternal glycogen reserve essential for embryonic development in zebrafish
- All Figures
- Figures for Chen et al., 2024
|
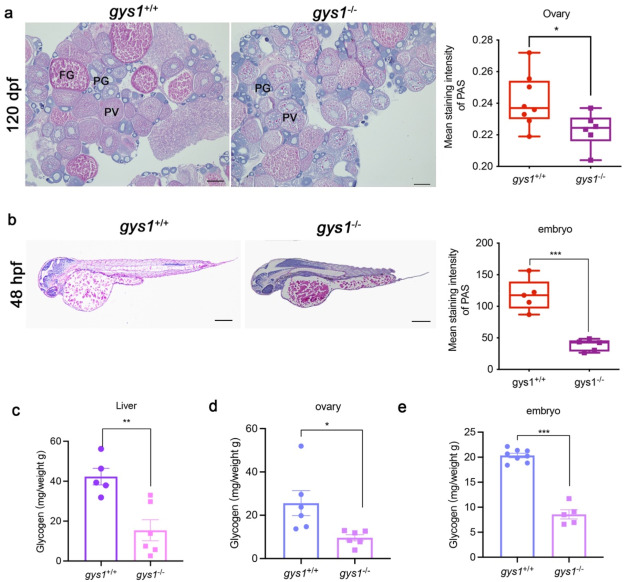
Fig. 3 Maternal loss of gys1 caused reduced of ovarian (F2) and embryonic (F3) glycogen reserve. (a) Representative photographes of PAS glycogen staining in ovaries of F2 gys1 WT and gys1 MT (left) in adults; Unpaired t-test statistical analysis of average PAS staining intensity in F2 g gys1 WT and gys1 MT ovarian glycogen staining (right, gys1WT n = 8, gys1MT n = 7, Scale bar = 200 μm *P < 0.05). PG: primary growth stage; PV: pre-vitellogenic stage; FG: full growth stage. (b) Representative photos of PAS glycogen staining in F3 gys1 WT and gys1 MT embryos at 48 hpf (left). Unpaired t-test statistical analysis of average staining intensity analysis of glycogen accumulation in embryos (right, gys1WT n = 5, gys1MT n = 5, Scale bar = 200 μm, ***p < 0.001). (c–e) Glycogen content (mg) per weight (g) analysis of liver (gys1WT n = 5, gys1MT n = 6, **p < 0.01), ovary (gys1WT n = 6, gys1MT n = 6, *p < 0.05) in 180 dpf adults and 24 hpf embryo (gys1WT n = 8, gys1MT n = 8, ***p < 0.001). Unpaired t-test was used as the statistical analysis.