
|
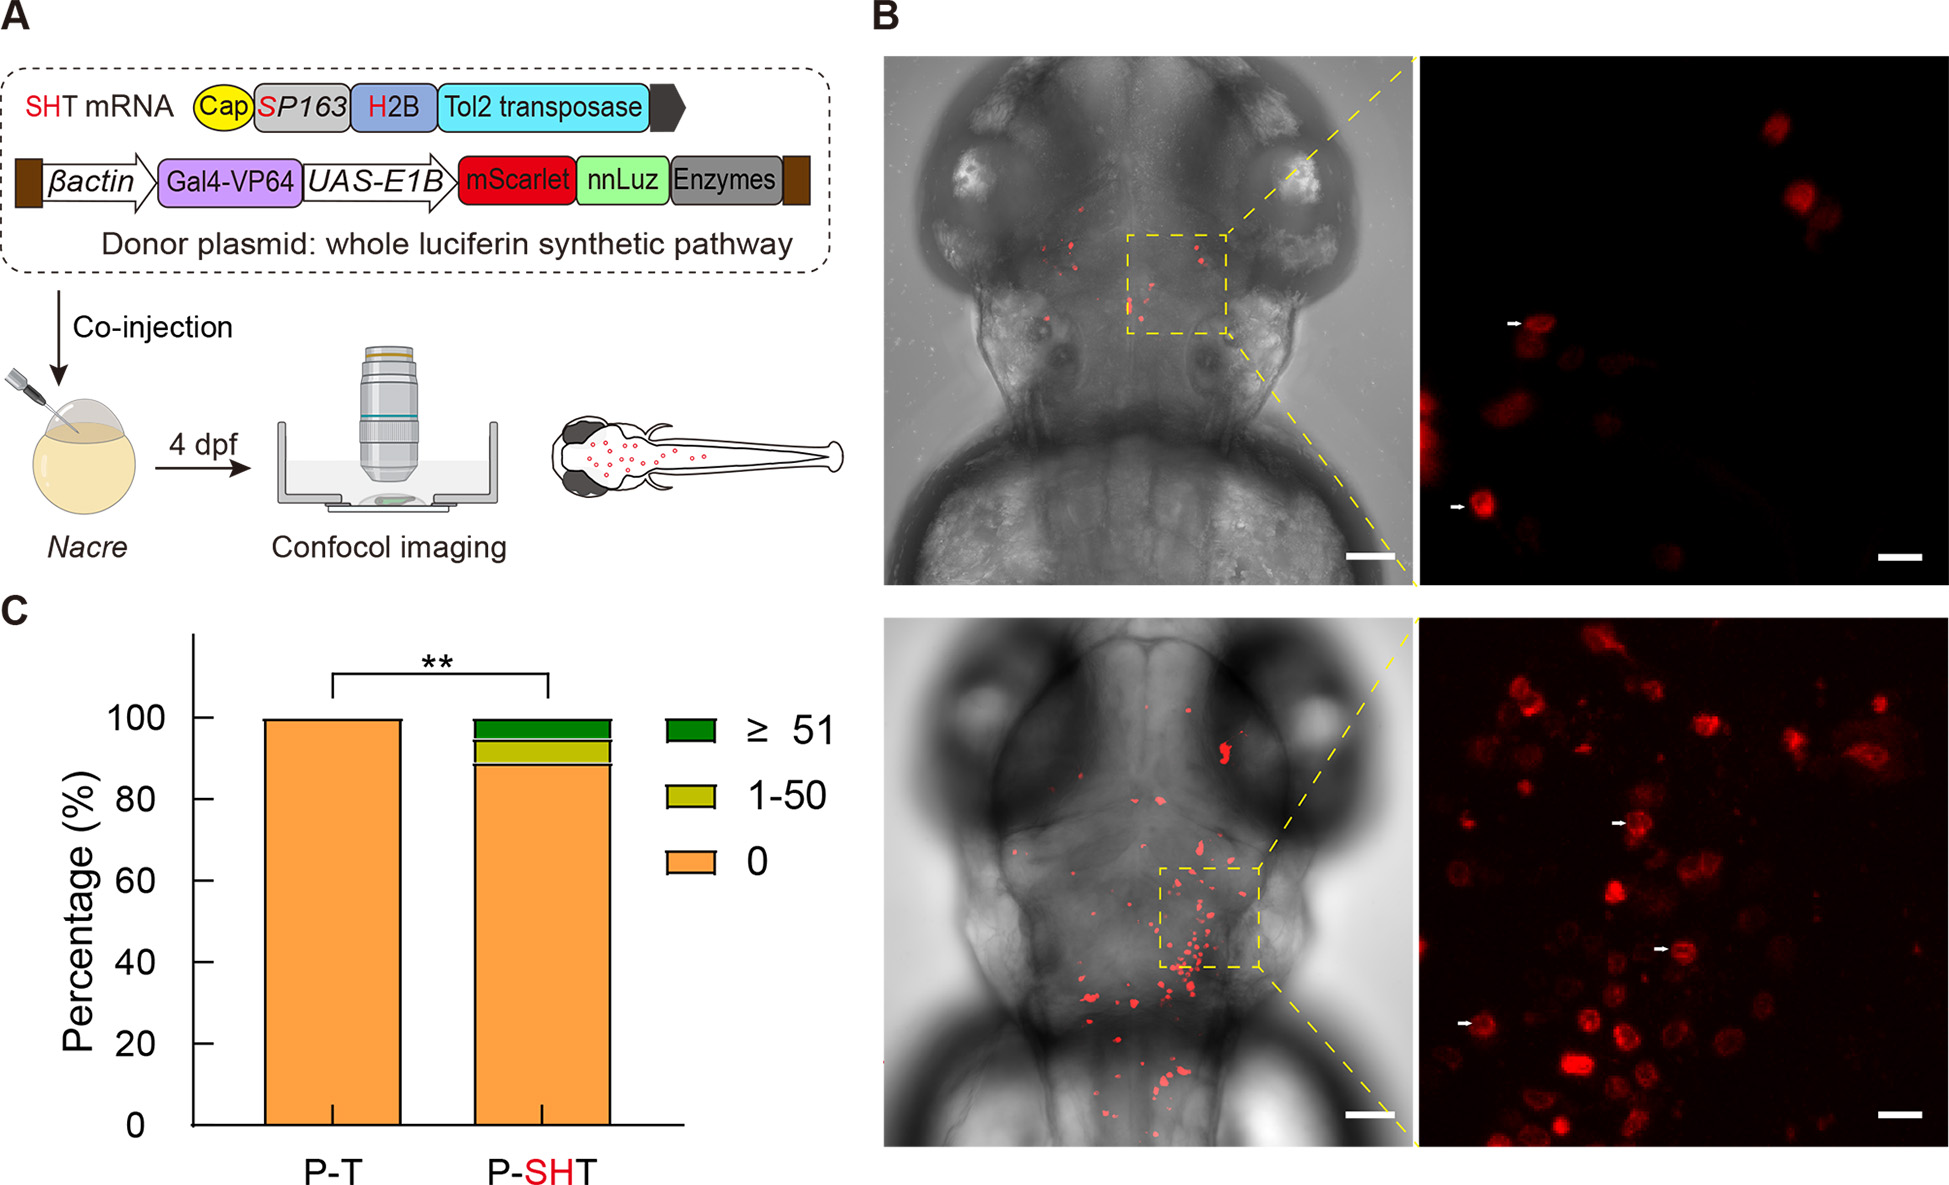
Fig. 4 Transposition of whole luciferin metabolic pathway in zebrafish A: Schematic of measurement of in vivo transposition efficiencies of modified Tol2 transposases with a donor plasmid carrying the whole luciferin synthetic pathway (24 kb). dpf: Days post-fertilization. B, C: Confocal images of F0 embryos showing patterns of mScarlet-positive cell cytoplasm (top, Group 2; bottom, Group 3) in 4 dpf larval zebrafish. Enlarged views of boxed areas are shown on the right (B). Categorization was based on number of red fluorescent cells in larval zebrafish. P-T: Tol2 mRNA (n=103), P-SHT: SP163-H2B-Tol2 mRNA (n=119) (C). Scale bars in 4B: left, 50 μm; right, 10 μm. **: P<0.01. Chi-square test for trend.