
|
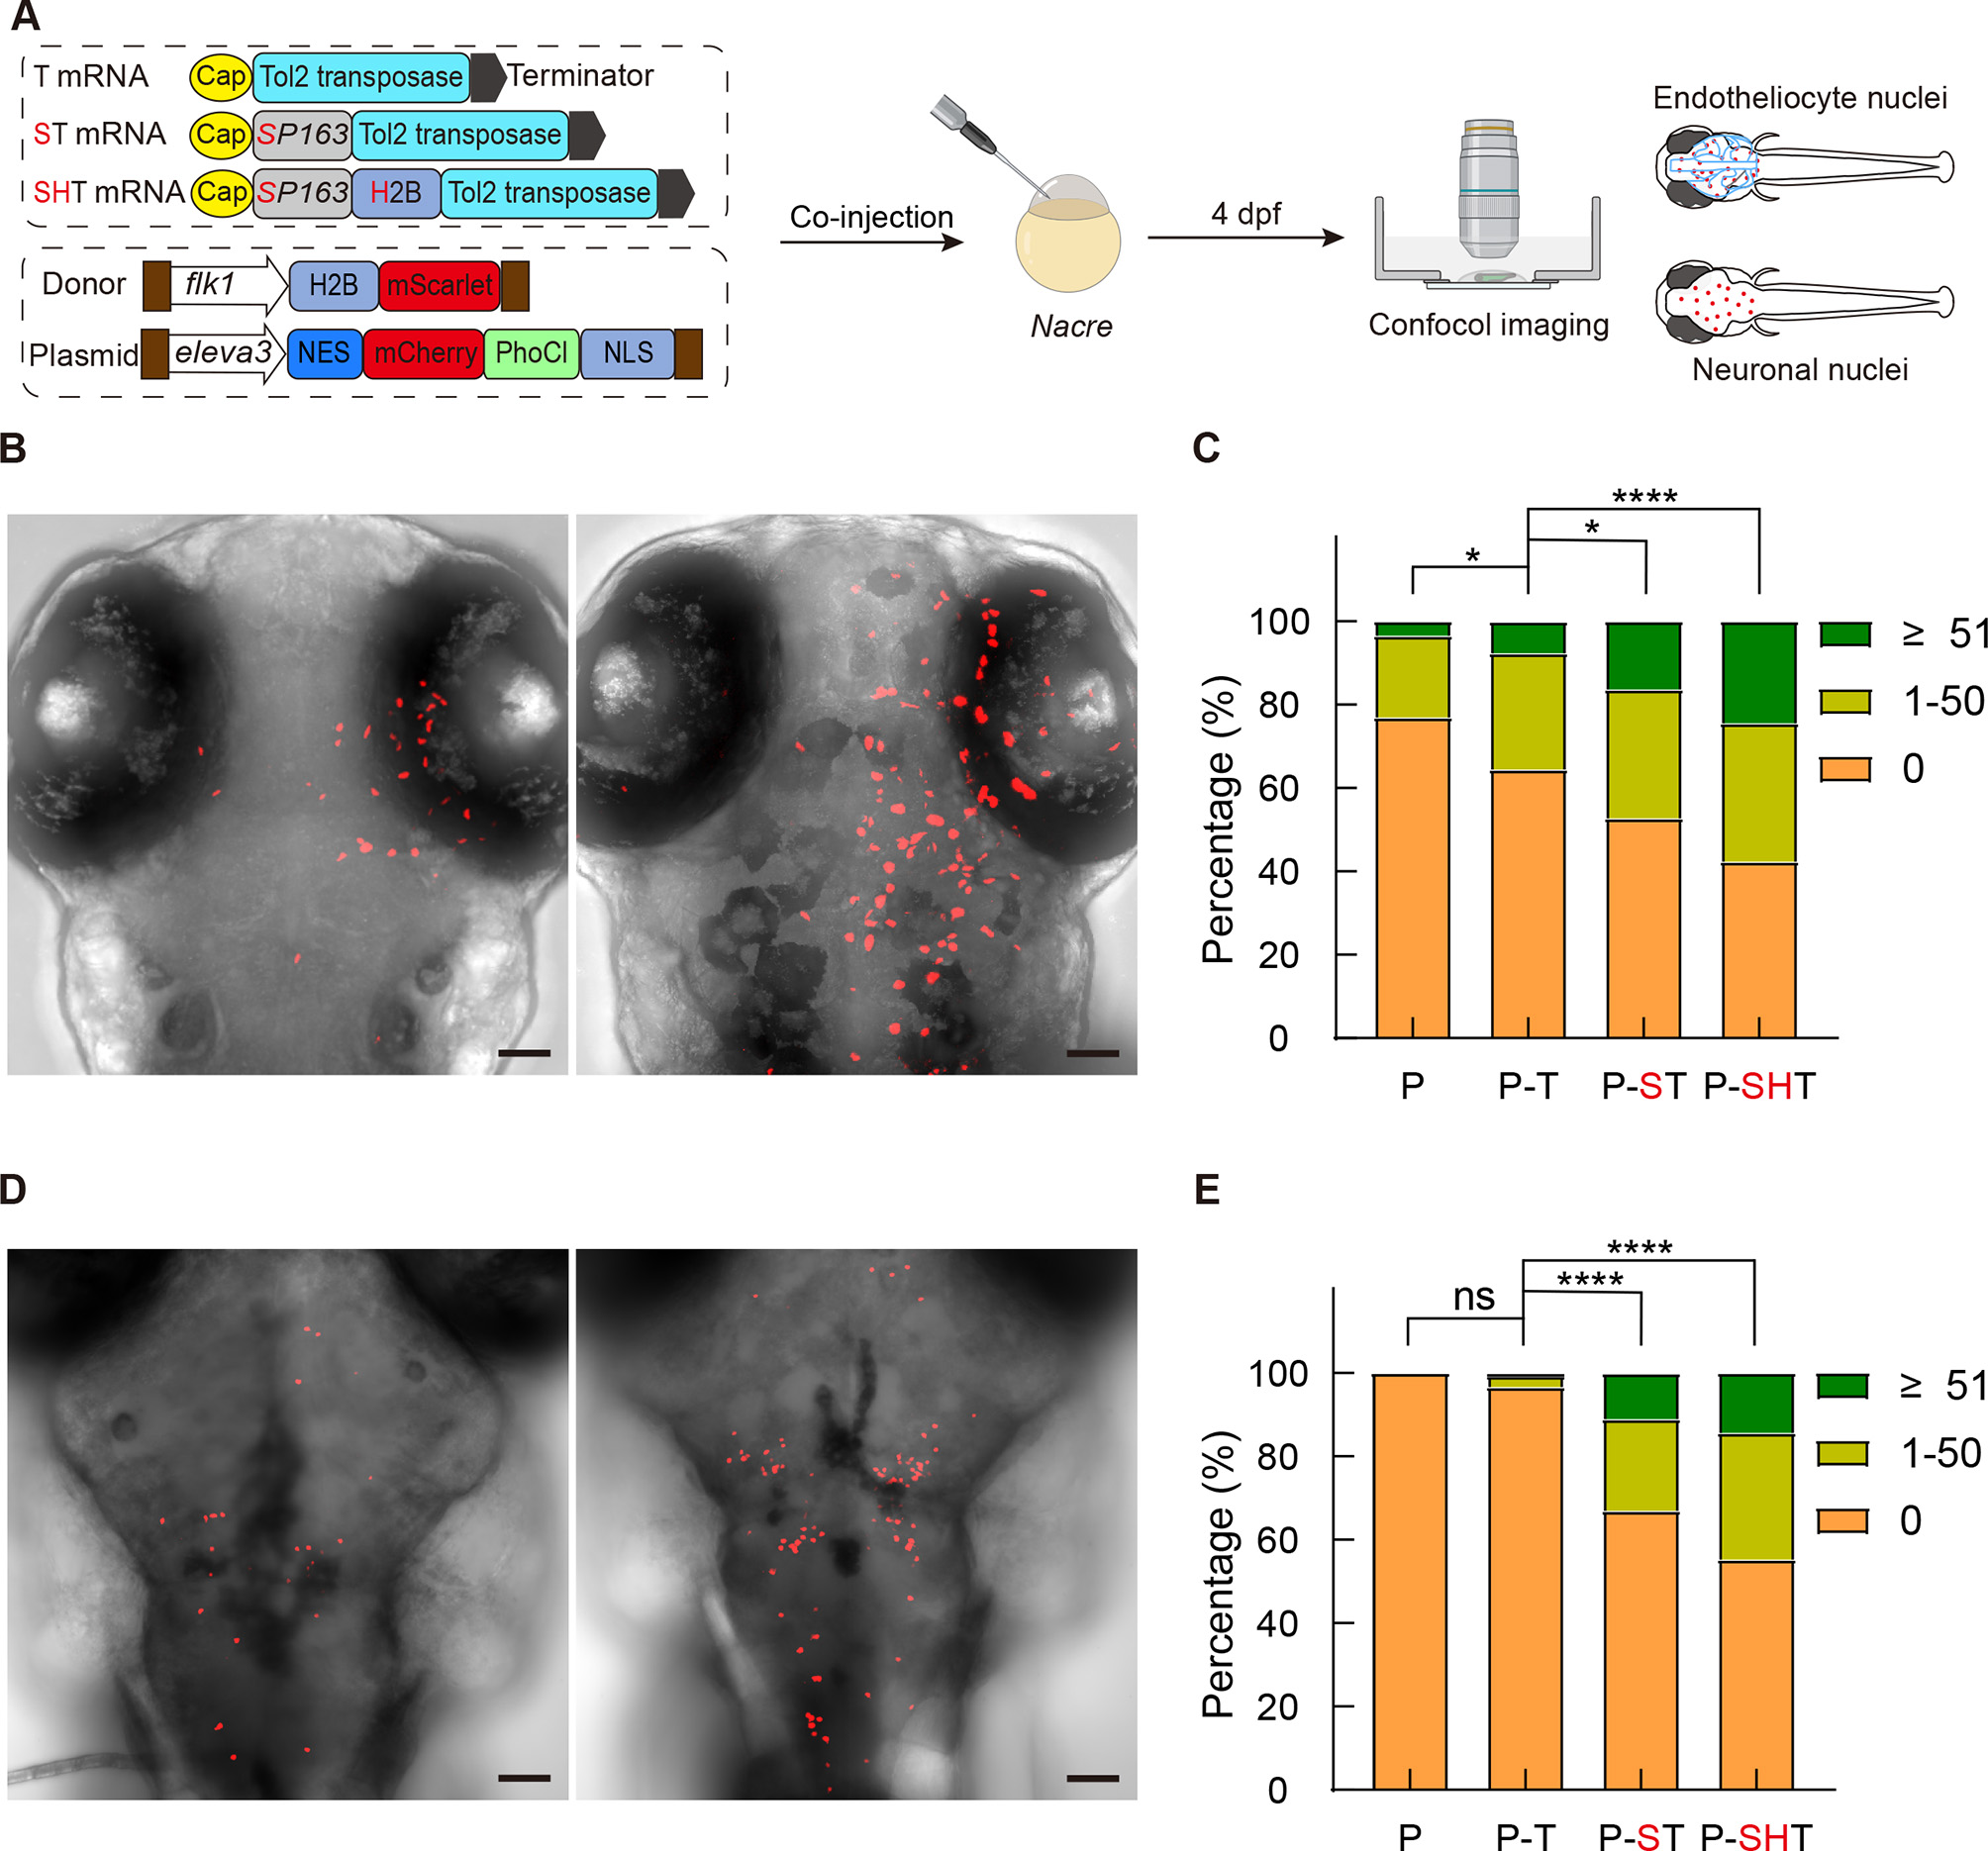
Fig. 3 Characterization of transposition efficiency of different Tol2 transposases in zebrafish A: Schematic of measurement of in vivo transposition efficiencies of various Tol2 transposases with two different donor plasmids carrying 8 kb and 14 kb cargo, respectively. dpf: Days post-fertilization. B, C: Representative images of F0 embryos showing patterns of mScarlet-positive endothelial cell nuclei (left, Group 2; right, Group 3) observed in 4 dpf larval zebrafish (B). Categorization was based on number of red fluorescent cells in larval zebrafish: (1) Group 1: No fluorescent cells; (2) Group 2: 1–50 fluorescent cells; (3) Group 3: No less than 51 fluorescent cells. P: Only donor plasmid; P-T, P-ST, P-SHT: Co-injection of donor plasmid with Tol2, SP163-Tol2, and SP163-H2B-Tol2 mRNA, respectively (C). Total fish numbers (n) were 117, 104, 110, and 184 for P, P-T, P-ST and P-SHT, respectively. D, E: Representative images (D) and corresponding statistical results (E) depicting Tol2 transposase-dependent transgenesis for labeling neuronal nuclei in 4 dpf larval zebrafish. Total fish numbers (n) were 101, 150, 127, and 125 for P, P-T, P-ST and P-SHT, respectively. Scale bars in 3B and 3D: 50 μm. ns: Not significant; *: P<0.05; ****: P<0.0001. Chi-square test for trend.