
|
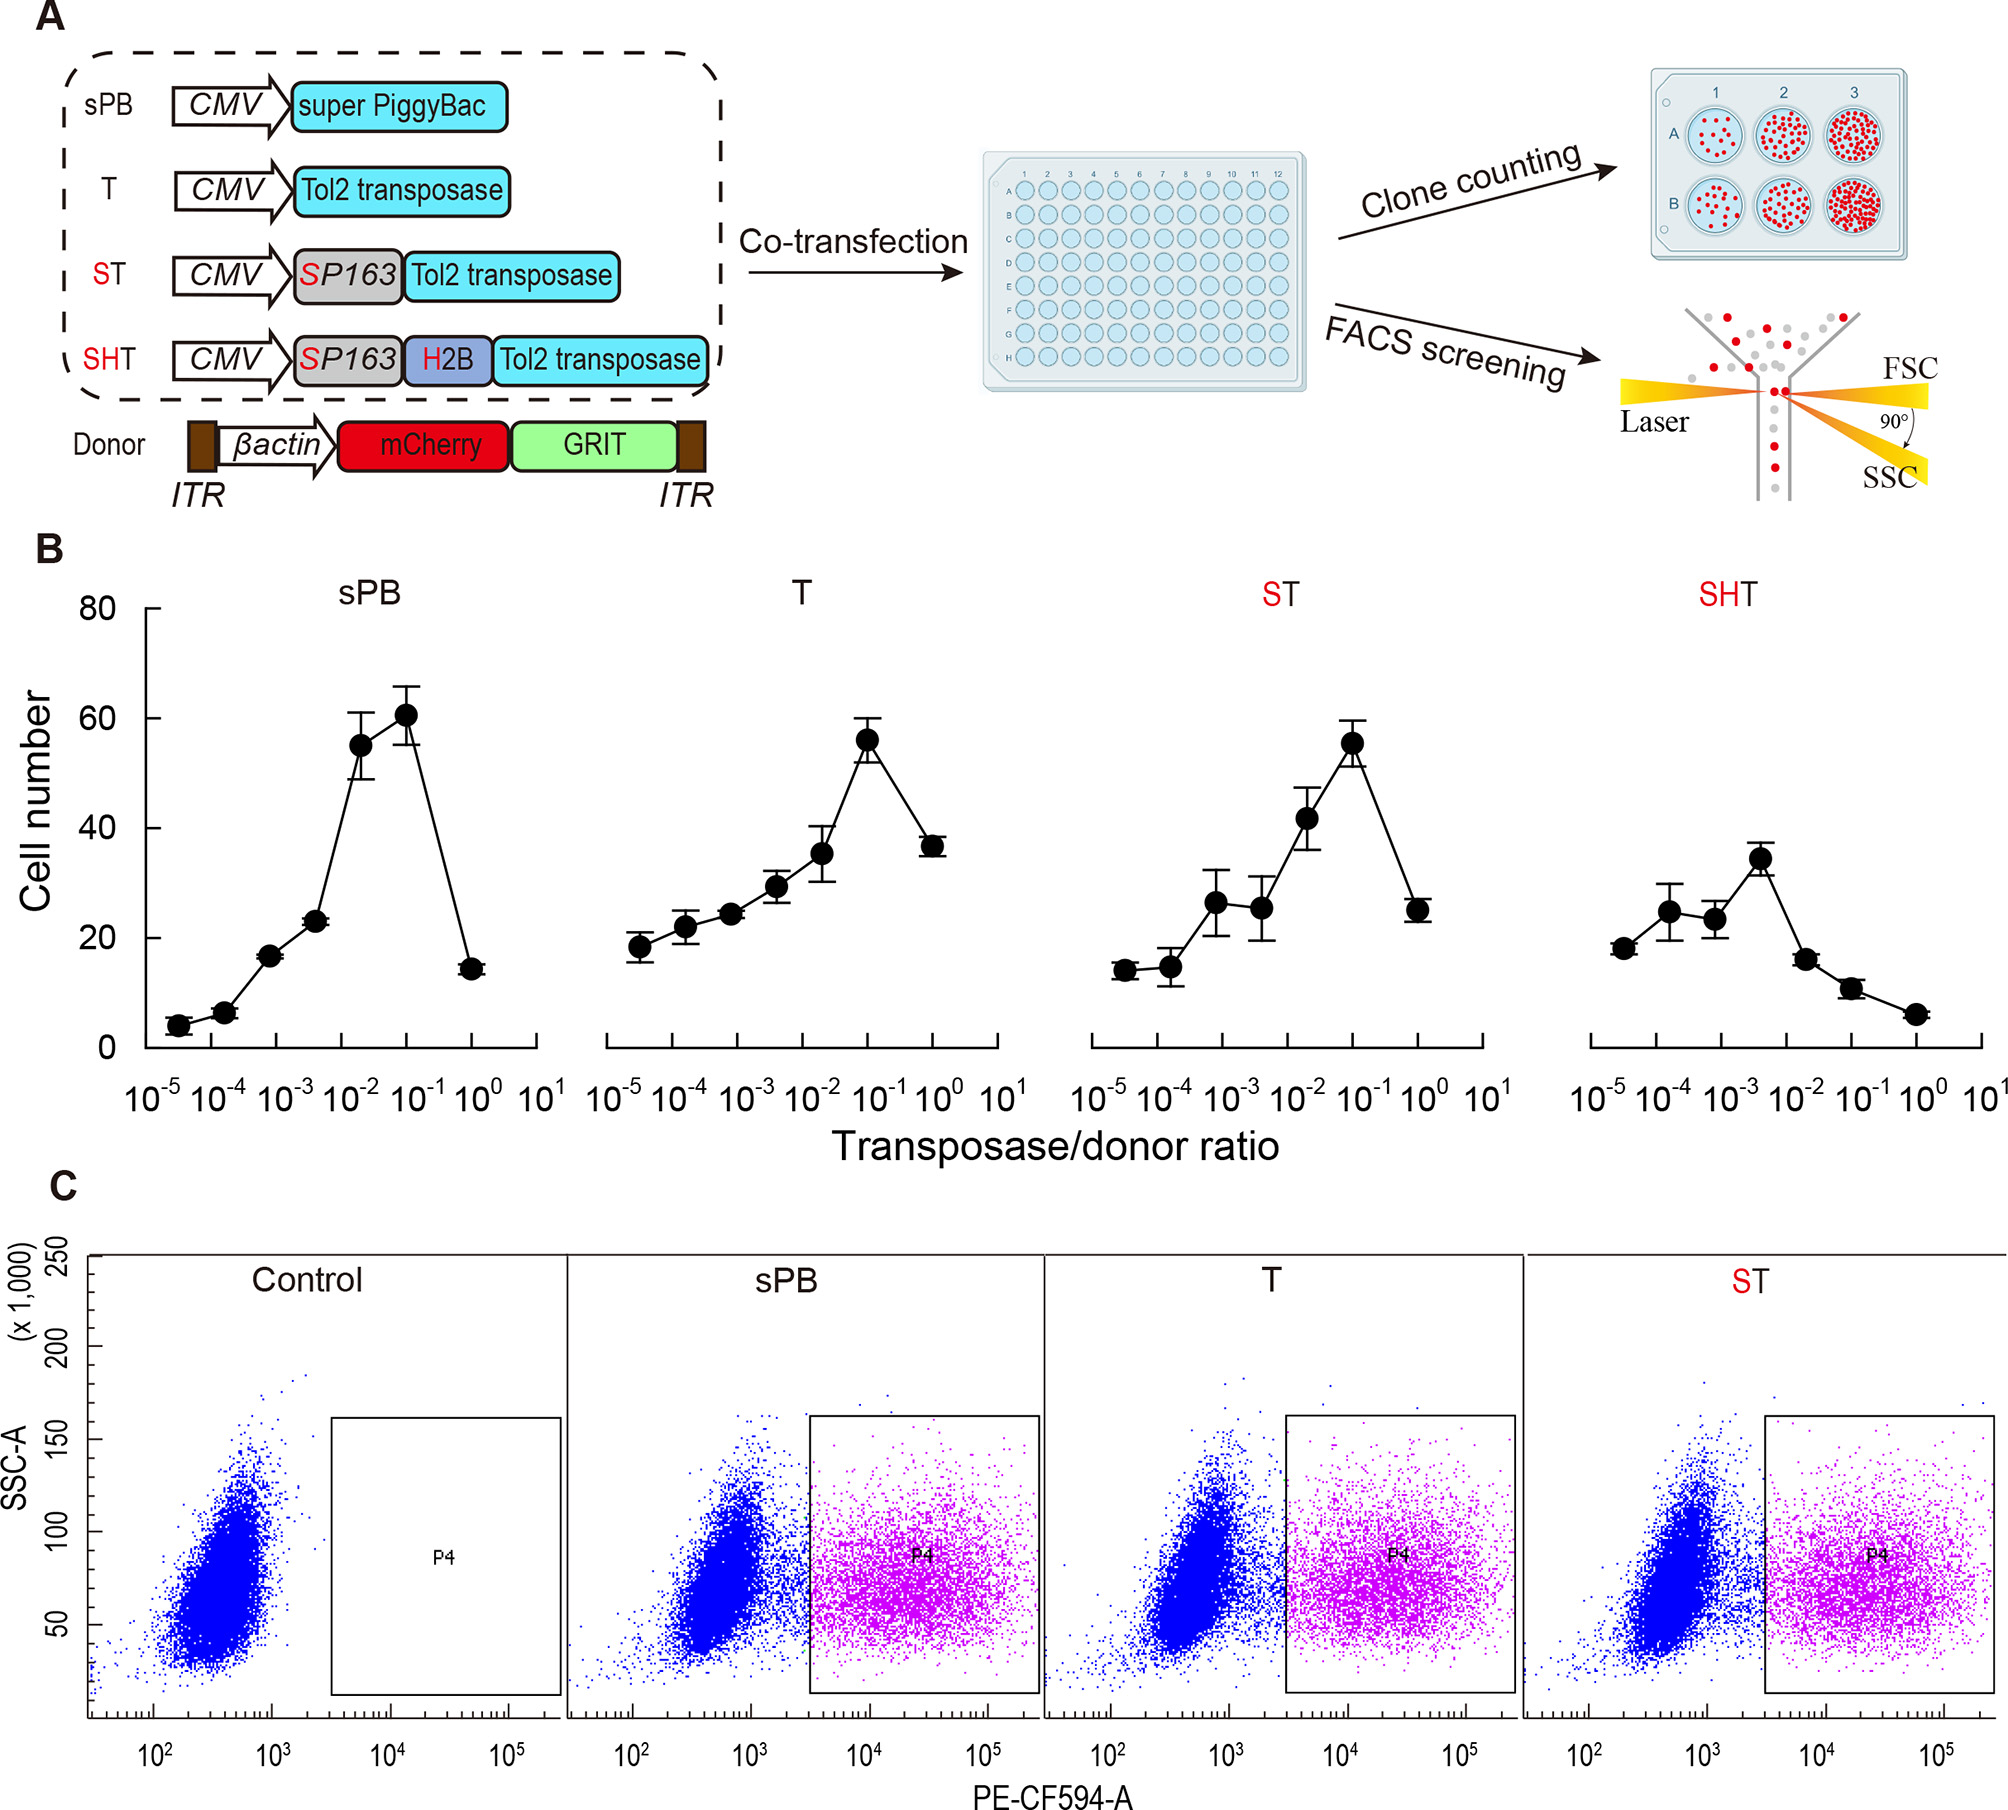
Fig. 2 Characterization of different Tol2 transposases in transfected H1299 cells A: Schematic of transposition efficiency of super PiggyBac (sPB) and various Tol2 transposases. Efficiency was assessed through co-transfection of transposon and donor plasmids, followed by quantification of cell clones and FACS analysis. B: Comparison of sPB with different Tol2 transposases based on efficacy of stable transgene integration. Analysis was conducted at various transposon plasmid dosages while maintaining a constant donor plasmid dosage. C: Quantification of stable integrated cell ratios for sPB, T, and ST at a transposase/donor plasmid ratio of 1:10 using FACS analysis. n=3 independent experiments.