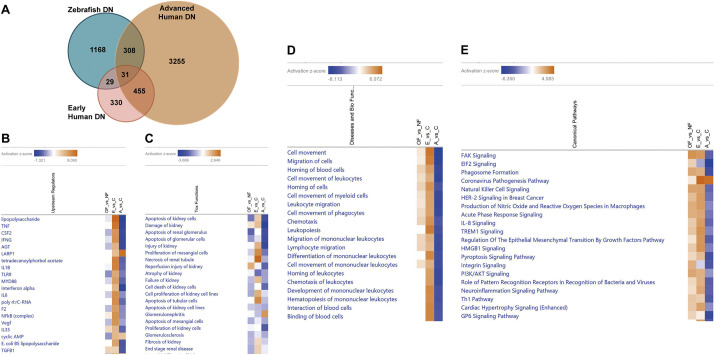
Comparative transcriptome analysis results for zebrafish DN, early human DN and advanced human DN. (A) Venn diagram for the overlapping differentially expressed genes (DEGs) among zebrafish DN, early human DN and advanced human DN. (B-E) Heatmaps show the results of comparing functional Ingenuity Pathway Analysis (IPA) of the three groups, including the top 20 upstream regulators (B), toxicity functions (nephrotoxicity) (C), disease and biofunctions (D) and canonical pathways (E). Regulators, functions and pathways are ranked based on the z-score that predicts activation (orange) and inhibition (blue). OF_vs_NF, overfeeding versus normal feeding; E_vs_C, early human DN versus human control; A_vs_C, advanced human DN versus human control.
Acknowledgments
This image is the copyrighted work of the attributed author or publisher, and
ZFIN has permission only to display this image to its users.
Additional permissions should be obtained from the applicable author or publisher of the image.
Full text @ Dis. Model. Mech.
Your Input Welcome
Thank you for submitting comments. Your input has been emailed to ZFIN curators who may contact you if
additional information is required.
Oops. Something went wrong. Please try again later.