
IMAGE
Fig. 2.
- ID
- ZDB-IMAGE-240606-61
- Publication
- Isiaku et al., 2024 - A nox2/cybb zebrafish mutant with defective myeloid cell reactive oxygen species production displays normal initial neutrophil recruitment to sterile tail injuries
- All Figures
- Figures for Isiaku et al., 2024
Image
|
Figure Caption
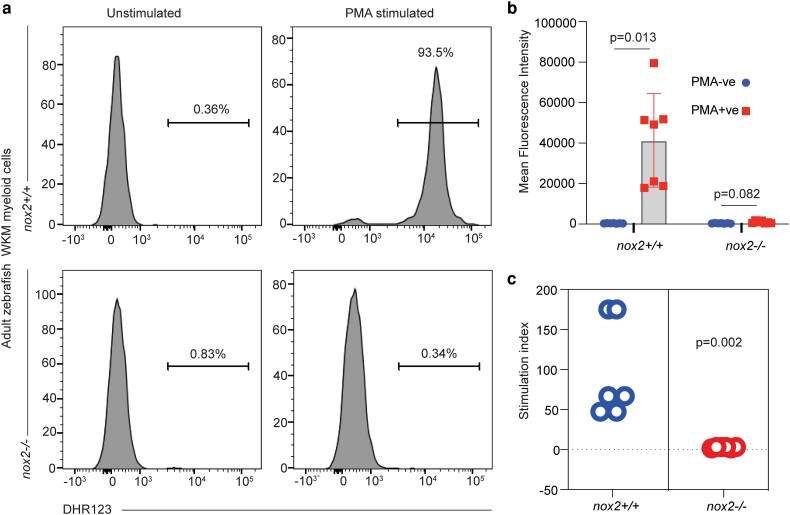
Fig. 2.
ROS deficiency in adult
Figure Data
Acknowledgments
This image is the copyrighted work of the attributed author or publisher, and
ZFIN has permission only to display this image to its users.
Additional permissions should be obtained from the applicable author or publisher of the image.
Full text @ G3 (Bethesda)