
Fig. 3
- ID
- ZDB-IMAGE-240605-8
- Publication
- Whyte-Fagundes et al., 2024 - Testing of putative antiseizure medications in a preclinical Dravet syndrome zebrafish model
- All Figures
- Figures for Whyte-Fagundes et al., 2024
|
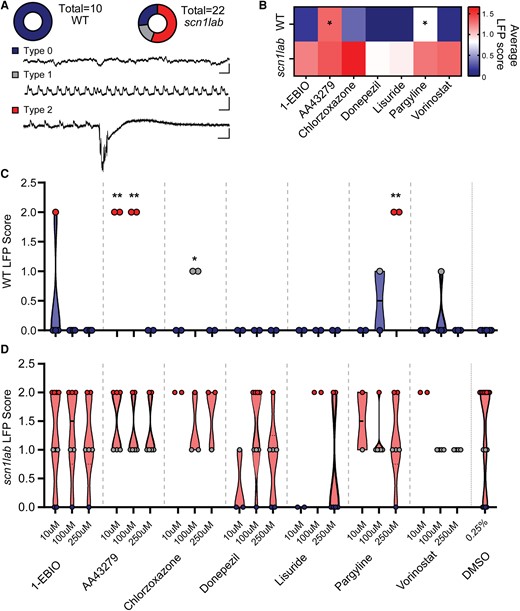
Fig. 3 Electrophysiological recordings of larvae treated with candidate ASMs. (A) Donut plots of untreated WT (left, N = 10) and scn1lab (right, N = 22) larvae showing the distribution of type 0 (normal), type 1 (interictal-like) and type 2 (ictal-like) electrical activity along with representative LFP traces. (B) Heatmap of average LFP scores for both WT and scn1lab larvae after treatment with candidate ASMs at three different concentrations showing a significant increase in activity for WT larvae treated with AA43279 (N = 7, P = 0.01) and pargyline (N = 7, P = 0.05). (C) Violin plot showing scored electrophysiological recordings from individual WT larvae after treatment with candidate ASMs at each concentration. AA43279, Chlorzoxazone and Pargyline significantly induced abnormal activity in WT larvae compared to control DMSO treatment (N = 2–4 per condition across 2–3 replicates, P < 0.0001). 1-EBIO-induced type 2 and vorinostat-induced type 1 events in 1 out of 4 larvae. (D) Violin plot showing scored electrophysiological recordings from individual scn1lab larvae. No drugs reliably prevented seizure activity compared to control DMSO-treated larvae, with only some drugs having a mild modulatory effect on seizure activity (N = 2–6 per condition across 2–4 replicates). Statistical tests include Kruskal-Wallis and One-way ANOVA, P < 0.05 = *, P < 0.0001 = **, all other data were not significantly different. Scale for traces are 1 s by 0.1 mV.