IMAGE

FIGURE 2

ID
ZDB-IMAGE-240603-94
Source
Figures for Lyu et al., 2024
Image
Figure Caption

FIGURE 2

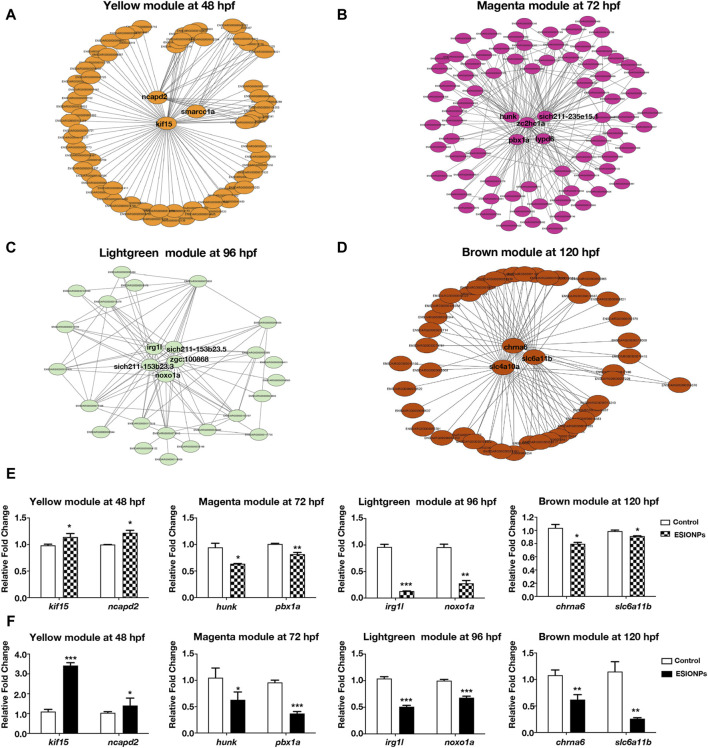
Networks of genes in different modules. (A) The key hub genes were shown in Yellow Module (ncapd2, smarcc1a, kif15). (B) The key hub genes were shown in Magenta Module (hunk, pbx1a, zc2hc1a, lypd6, sich211-235e15.1). (C) The key hub genes were shown in Lightgreen Module (irg1l, sich211-153b23.5, noxo1a, sich211-153b23.3, zgc:100868). (D) The key hub genes were shown in Magenta Module (chrna6, slc4a10a, slc6a11b). (E,F) Gene expression of the key hub genes in 4 modules by RNA-seq (E) and qRT-PCR (F). Value are normalized to Control group, and represent mean ± SE from three independent experiments, * p-value < 0.05, ** p-value < 0.01, *** p-value < 0.001 (Student’s t-test).

Acknowledgments
This image is the copyrighted work of the attributed author or publisher, and ZFIN has permission only to display this image to its users. Additional permissions should be obtained from the applicable author or publisher of the image. Full text @ Front Genet