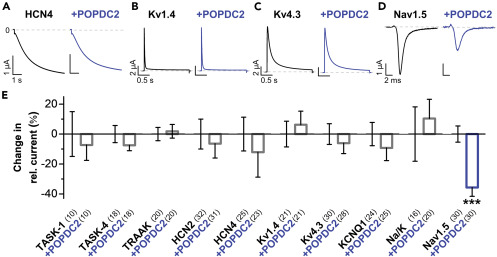
Fig. 1 Functional screen for cardiac ion channels modulated by POPDC2 (A–D) Representative current traces of (A) HCN4, applying a voltage step from −30 mV to −120 mV within 6 s, from a holding potential of −30 mV, (B) Kv1.4, applying a voltage step from −80 mV to +40 mV within 2 s, from a holding potential of −80 mV, (C) Kv4.3, applying a voltage step from −80 mV to +40 mV within 2 s, from a holding potential of −80 mV or (D) Nav1.5, applying a voltage step from −80 mV to −20 mV within 50 ms, from a holding potential of −80 mV, expressed alone (black) or together with POPDC2 (blue) in Xenopus laevis oocytes. (E) Indicated cardiac channels or the Na+/K+ ATPase (Na/K) were expressed alone or together with POPDC2 in Xenopus oocytes and relative changes in current amplitudes by POPDC2 were plotted. Oocytes were stored in a storage solution lacking theophylline. The number of technical replicates (n) is indicated in parentheses. Data are presented as mean ± s.e.m. Significance was probed using a two-sided Student’s t-test. ∗∗∗, p < 0.001.
Image
Figure Caption
Acknowledgments
This image is the copyrighted work of the attributed author or publisher, and
ZFIN has permission only to display this image to its users.
Additional permissions should be obtained from the applicable author or publisher of the image.
Full text @ iScience

