|
FIGURE 3
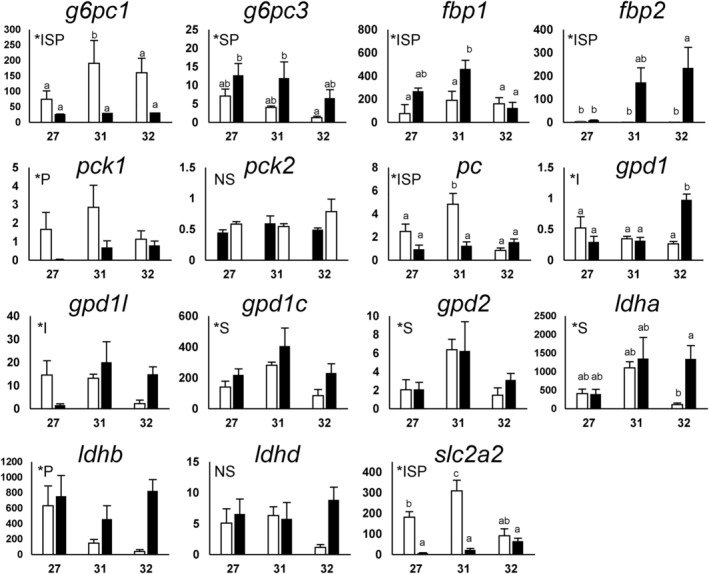
Changes in expression levels of the selected genes during development. The expression levels of gluconeogenesis‐related genes and glucose transporter (GLUT) gene

|
|
FIGURE 3
Changes in expression levels of the selected genes during development. The expression levels of gluconeogenesis‐related genes and glucose transporter (GLUT) gene