
Image
|
Figure Caption
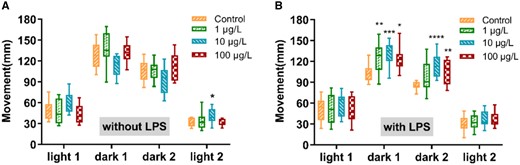
Fig. 6 Movement of F1 zebrafish following parental exposure to the control group and treatments (1, 10, and 100 μg CBZ/L) at 5 dpf. A, Movement of F1 larvae exposed to CBZ (group I). B, Movement of F1 larva exposed to CBZ added LPS (group III)
Acknowledgments
This image is the copyrighted work of the attributed author or publisher, and
ZFIN has permission only to display this image to its users.
Additional permissions should be obtained from the applicable author or publisher of the image.
Full text @ Toxicol. Sci.