
Fig. 2
- ID
- ZDB-IMAGE-240529-58
- Publication
- Del Prado et al., 2024 - Comparing robotic and manual injection methods in zebrafish embryos for high-throughput RNA silencing using CRISPR-RfxCas13d
- All Figures
- Figures for Del Prado et al., 2024
|
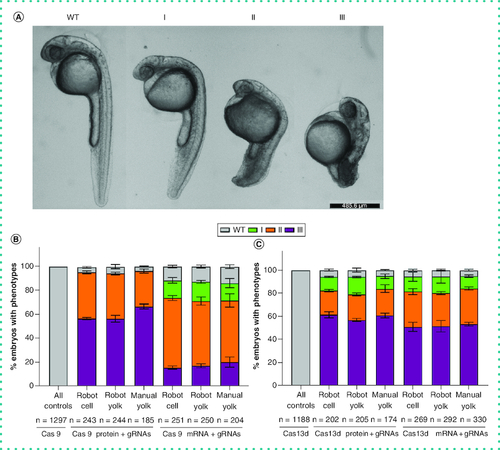
Fig. 2 Percentage of zebrafish embryos with different grades of no tail phenotype caused by TBXTA gene knockdown. (A) Knockdown of the TBXTA gene using both Cas9 and RfxCas13d (CasRx) systems results in different levels of no tail phenotype. Representative phenotype images are acquired from CasRx injections. Scale bar = 485.6 μm. (B) Percentage of embryos of each grade of no tail phenotype caused by Cas9 protein or mRNA targeting TBXTA gene using automatic robot or manual injections. As all the control groups injected either with Cas9 protein or mRNA only show the wild-type phenotype, the authors combined all the control groups to one bar, namely “All controls” (Cas9 protein robot, n = 434; Cas9 protein manual, n = 213; Cas9 mRNA robot, n = 447; Cas9 mRNA manual, n = 203). (C) Percentage of embryos of each grade of no tail phenotype caused by CasRx protein or mRNA targeting TBXTA gene using automatic robot or manual injections. As all the control groups injected with either CasRx protein or mRNA only showed the wild-type phenotype, the authors combined all the control groups to one bar, namely “All controls” (CasRx protein robot, n = 334; Cas13d protein manual, n = 173; CasRx mRNA robot, n = 432; CasRx mRNA manual, n = 249). Type I: Short tail and normal notochord; type II: Notochord development failure and short tail; type III: Notochord development failure and shorter tail; WT: Normal tail and notochord.