
Image
|
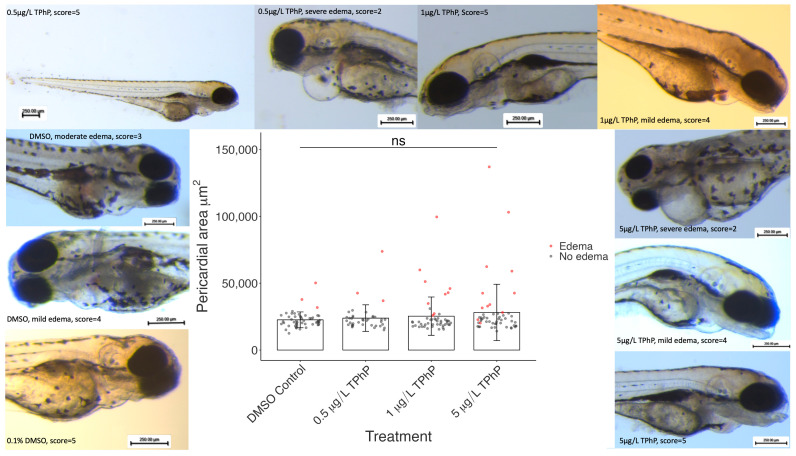
Figure Caption
Figure 3
Pericardial areas of fish treated with DMSO vehicle control or 0.5, 1, or 5 µg/L TPhP. Data points are shown: black data points represent fish with an edema score of 5 (normal), and red points represent fish scored below 5 (i.e., displaying pericardial edema). Border: representative images of fish from all dosage groups with a range of heart development scores.
Acknowledgments
This image is the copyrighted work of the attributed author or publisher, and
ZFIN has permission only to display this image to its users.
Additional permissions should be obtained from the applicable author or publisher of the image.
Full text @ Toxics