IMAGE

Fig. 4

ID
ZDB-IMAGE-240523-19
Source
Figures for Zhao et al., 2024
Image
Figure Caption

Fig. 4

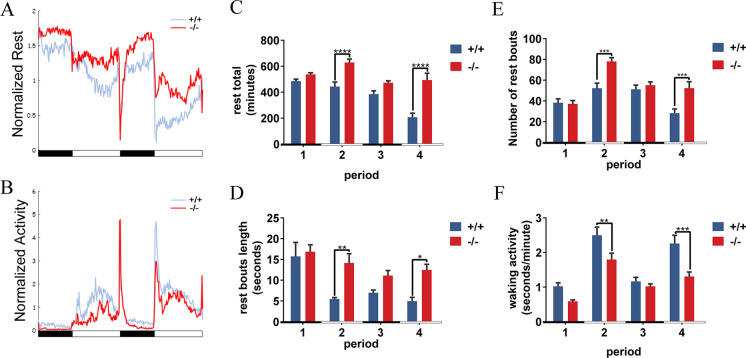
Abnormal sleep/wake pattern in P2RY11−/− mutants. A, B, showing time sequence photos of rest total (A) and waking activity (B). The red line represents the mutant group, while the blue line indicates the WT group. C-F, Parameter analysis showed that rest time (C) and rest bout length (D) were prolonged in P2RY11−/− mutants, with increased sleep frequency (E) during the daytime. Meanwhile, the waking activity (F) were decreased in the daytime recordings. The bars in black and white blow the x-axis indicate the tested nighttime and daytime periods, respectively. (t-test, n = 12, **p < 0.01, ***p < 0.001, ****p < 0.0001)

Acknowledgments
This image is the copyrighted work of the attributed author or publisher, and ZFIN has permission only to display this image to its users. Additional permissions should be obtained from the applicable author or publisher of the image. Full text @ Cell Biol. Toxicol.